Influencer marketing has become one of the strongest digital growth channels for brands today. Whether a business works with macro-influencers, micro-influencers, creators, or brand ambassadors, one thing remains essential—the ability to track engagement, impact, and return on investment accurately.Influencer Engagement KPI Dashboard in Google Sheets
Most brands struggle because their influencer analytics are scattered across platforms. Screenshots, spreadsheets, manual reporting, and inconsistent data make performance analysis difficult. This is where the Influencer Engagement KPI Dashboard in Google Sheets becomes a powerful, ready-to-use solution.Influencer Engagement KPI Dashboard in Google Sheets
What Is an Influencer Engagement KPI Dashboard in Google Sheets?
An Influencer Engagement KPI Dashboard is a structured analytics system that helps you track engagement, growth, performance, cost, and ROI of influencer campaigns. It displays:Influencer Engagement KPI Dashboard in Google Sheets
-
Monthly KPI performance
-
Yearly KPI performance
-
MTD, YTD, Target, and Previous Year comparisons
-
Churn, retention, and engagement trends
-
Visual charts for faster insights
-
KPI definitions to maintain consistency
Because the dashboard is built entirely in Google Sheets, it offers:
-
Real-time collaboration
-
Cloud access from any device
-
Simple monthly updates
-
No software installation
-
Easy sharing with teams and clients
This makes the dashboard powerful yet easy to maintain.
Key Features of the Influencer Engagement KPI Dashboard in Google Sheets
Click to Buy Influencer Engagement KPI Dashboard in Google Sheets
Your dashboard is designed using six functional worksheets, each supporting a different part of the analysis.
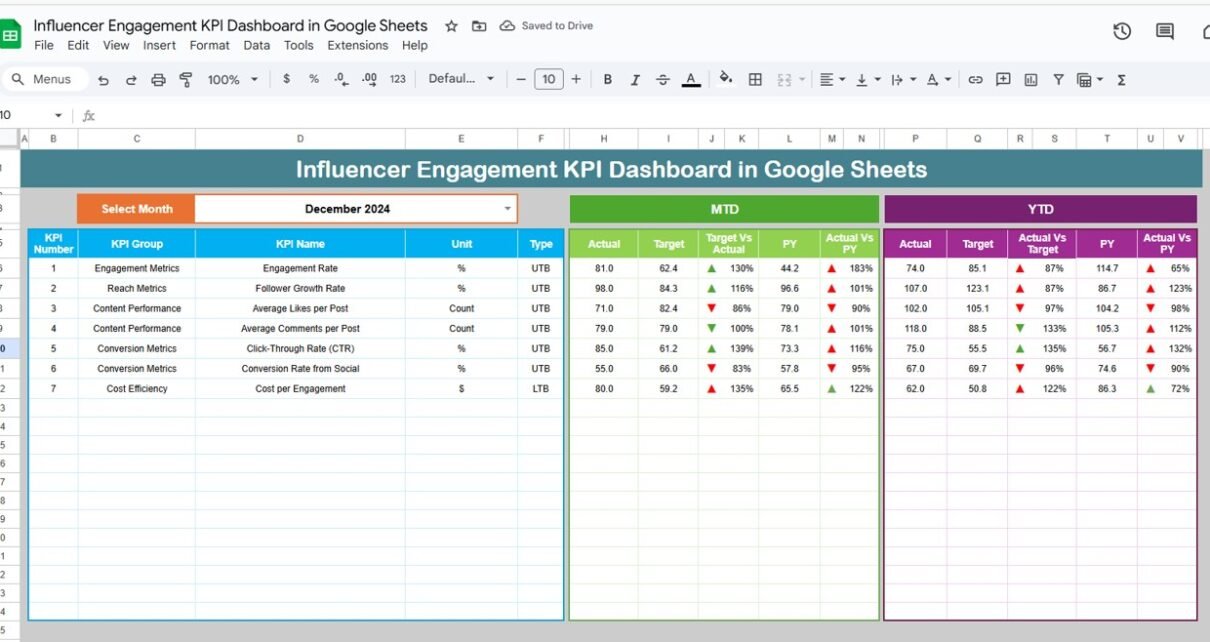
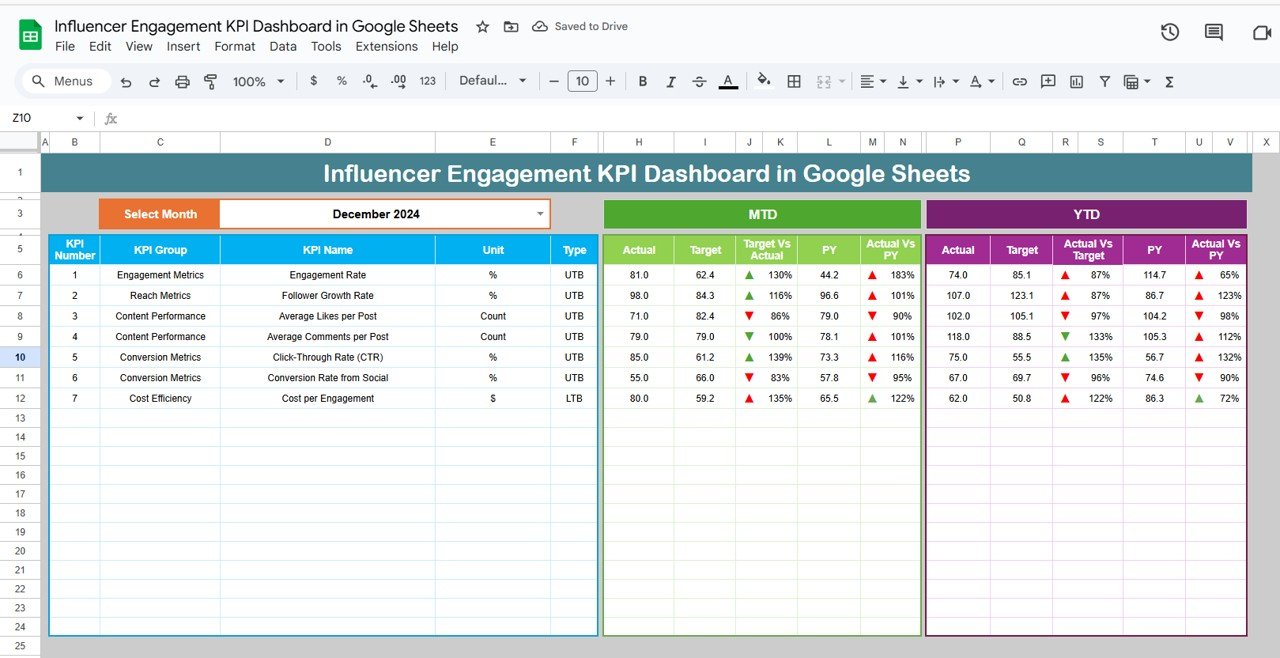
Dashboard Sheet Tab — The Main Performance Page
This is the center of your entire dashboard.
Month Selection
In cell D3, you can select any month from a drop-down list.
Once selected, the entire dashboard updates automatically.
KPI Values Displayed
Each comparison includes conditional formatting arrows (▲ or ▼) in green or red for instant interpretation.
This page helps marketing managers monitor monthly and yearly influencer performance at a glance.
Click to Buy Influencer Engagement KPI Dashboard in Google Sheets
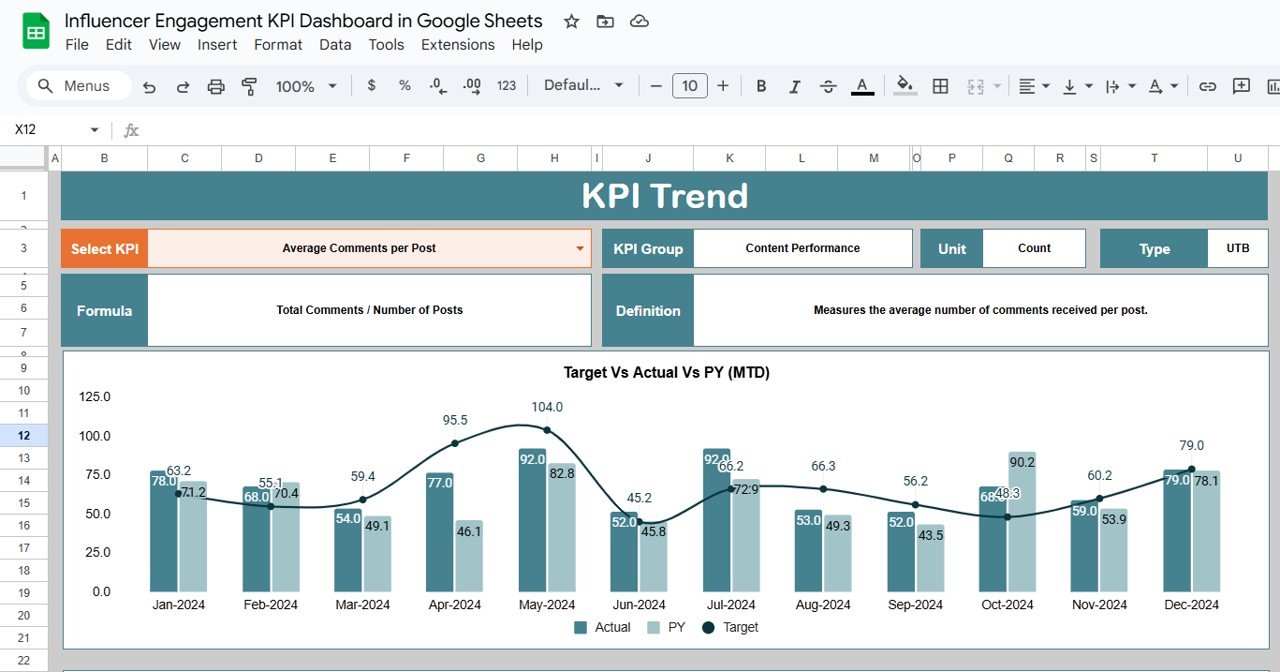
KPI Trend Sheet Tab — Detailed KPI Trend Analysis
This sheet provides a deeper view of individual KPIs.
KPI Selection (Cell C3)
You can select any KPI from a drop-down list.
Automatically Displayed Details
Once selected, the sheet displays:
-
KPI Group
-
KPI Unit
-
KPI Type (Upper The Better or Lower The Better)
-
KPI Formula
-
KPI Definition
- MTD Trend Chart: Shows how the KPI progressed month by month.
- YTD Trend Chart; Shows how the KPI performed across the year versus target and previous year.
This sheet is ideal for influencer comparison, monthly performance review, and long-term strategy building.
Click to Buy Influencer Engagement KPI Dashboard in Google Sheets
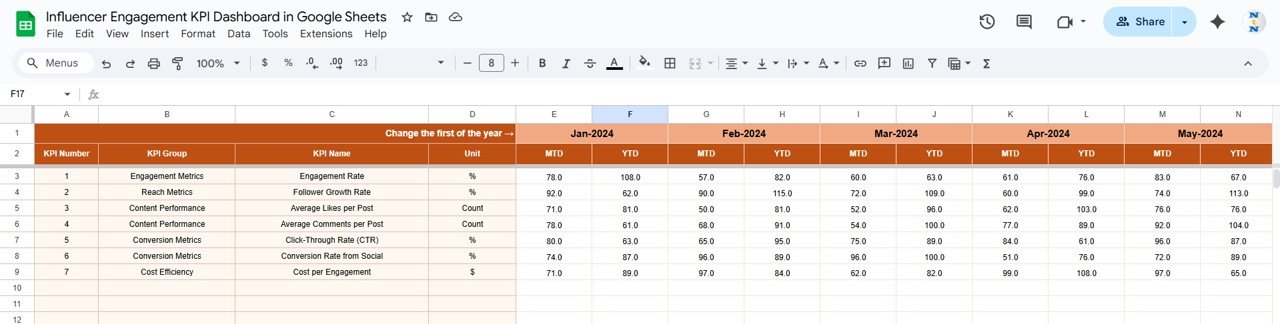
Actual Number Sheet Tab — Enter Actual Performance Data
This sheet is used to enter:
-
Actual MTD values
-
Actual YTD values
-
First month of the year (cell E1)
The dashboard uses these values to update all calculations.
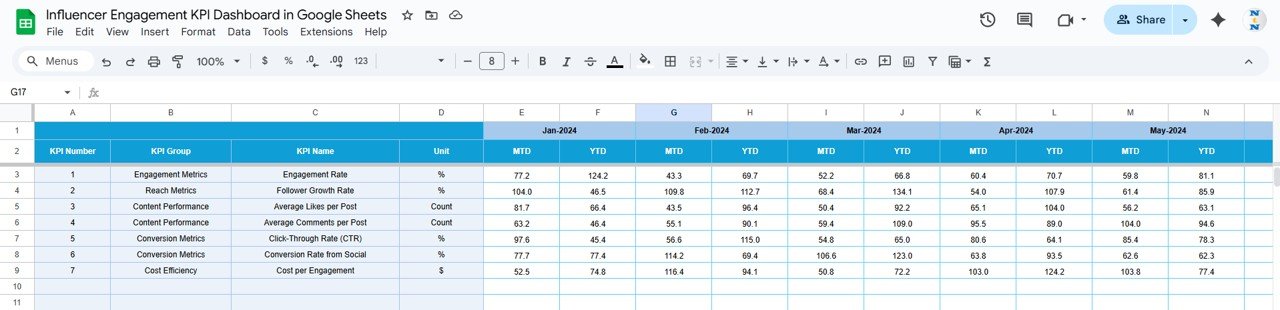
Target Sheet Tab — Enter Monthly KPI Targets
Here you must input:
-
Monthly targets for MTD
-
Monthly targets for YTD
This helps track performance against expectations.
Click to Buy Influencer Engagement KPI Dashboard in Google Sheets
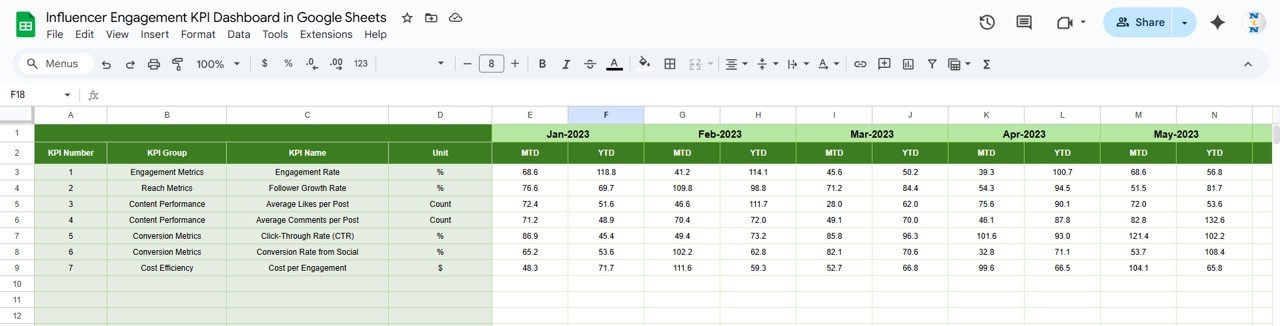
Previous Year Numbers Sheet — Historical Benchmarking
This sheet stores:
-
Previous year MTD values
-
Previous year YTD values
Year-over-year comparison helps evaluate real improvement.
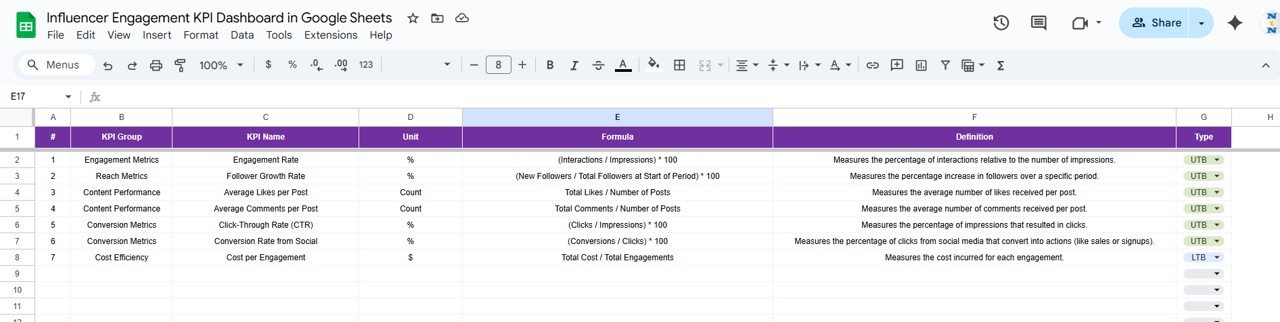
KPI Definition Sheet Tab — Master KPI Reference Sheet
This sheet includes:
-
KPI Name
-
KPI Group
-
KPI Unit
-
KPI Formula
-
KPI Definition
-
KPI Type (LTB or UTB)
This ensures consistency in how teams understand and measure KPI values.
Click to Buy Influencer Engagement KPI Dashboard in Google Sheets
Advantages of This Dashboard
- Real-time influencer analytics
- Track MTD, YTD, Target, and Previous Year values
- Monitor engagement and cost efficiency
- Compare influencers side-by-side
- Improve budget allocation
- Identify best-performing creators
- Understand content quality and audience behavior
Best Practices for Using This Dashboard
Click to Buy Influencer Engagement KPI Dashboard in Google Sheets
-
Update MTD and YTD values each month
-
Keep influencer names consistent across sheets
-
Use clean data to prevent formula errors
-
Compare year-over-year improvement regularly
-
Focus on ROI and cost KPIs for paid partnerships
-
Monitor engagement KPIs weekly to identify trends early
Conclusion
The Influencer Engagement KPI Dashboard in Google Sheets is a powerful solution for analyzing influencer campaigns. With structured worksheets, trend charts, KPI definitions, conditional formatting, and year-over-year comparisons, this dashboard helps brands unlock meaningful insights and improve decision-making.
Whether you manage one influencer or hundreds, this dashboard provides the clarity you need to scale your influencer marketing successfully.
Visit our YouTube channel to learn step-by-step video tutorials
Youtube.com/@NeotechNavigators
Watch the step-by-step video Demo:
Click to Buy Influencer Engagement KPI Dashboard in Google Sheets