Managing IT support tickets efficiently is crucial for IT teams to ensure timely resolution of issues, maintain service quality, and improve employee satisfaction. Our IT Support Ticket Dashboard in Google Sheets is a ready-to-use template that simplifies ticket tracking and helps IT managers analyze key metrics at a glance.
This dashboard is designed for IT teams, helpdesks, and support managers who want to monitor tickets, prioritize urgent issues, and measure team performance effectively.
Key Features of IT Support Ticket Dashboard
This dashboard template is organized into three sheets for comprehensive tracking and analysis:
1. Dashboard Sheet Tab
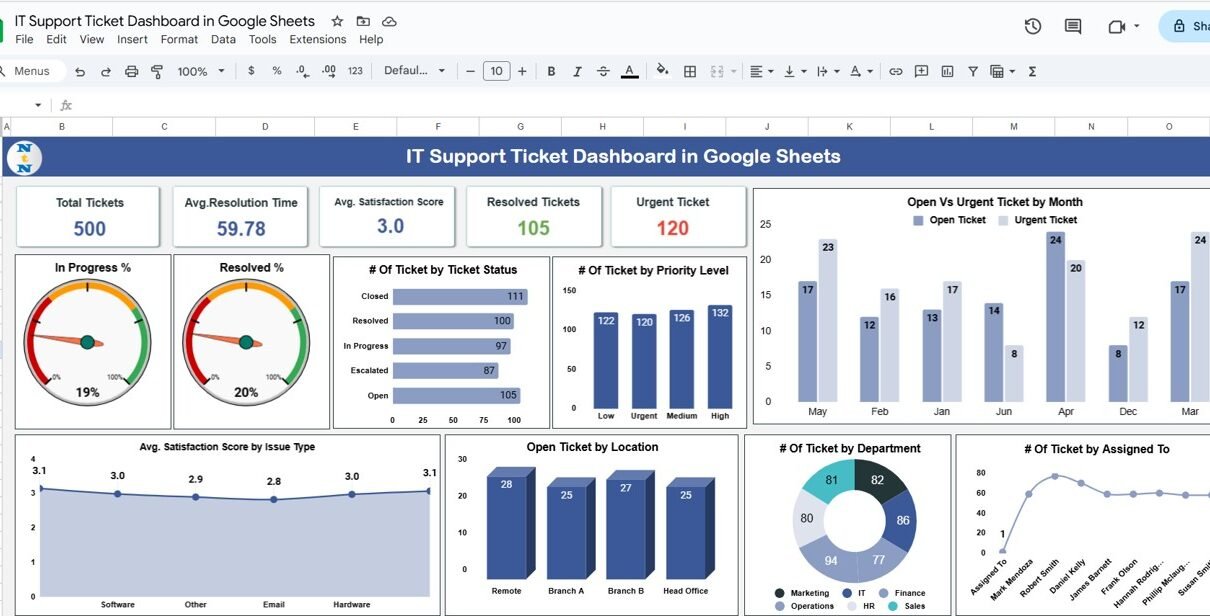
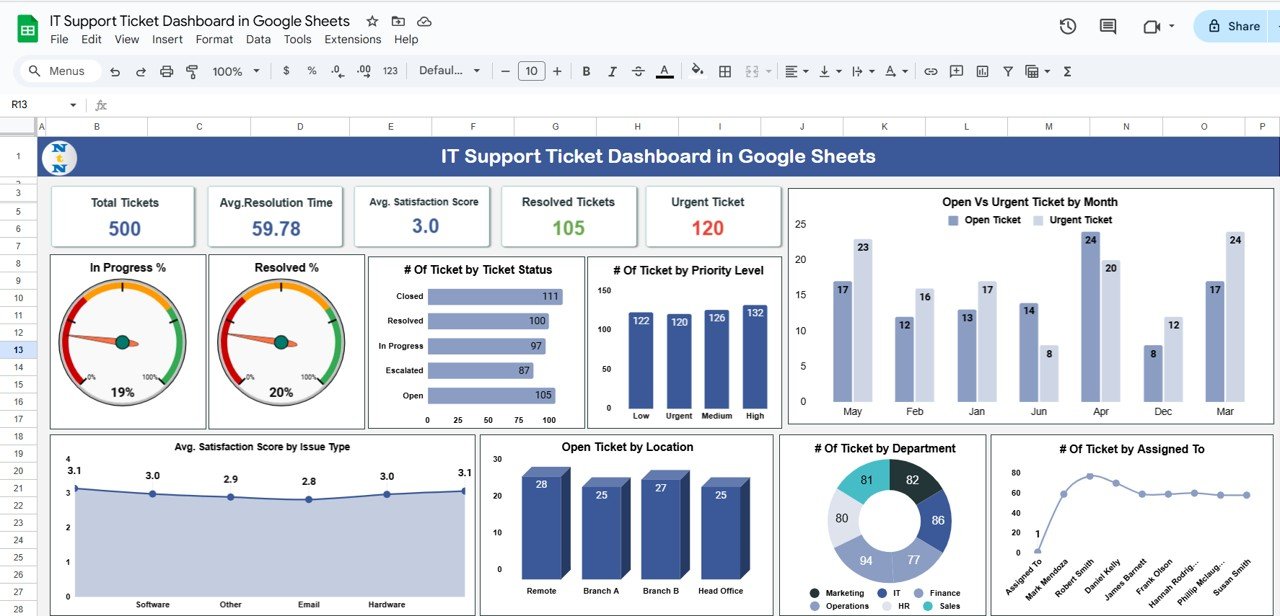
The Dashboard Sheet provides an interactive overview of all IT support tickets.
Cards Display:
-
# Of Tickets – Total number of tickets in the system
-
Avg. Resolution Time (Hours) – Average time taken to resolve tickets
-
Avg. Satisfaction Score – Average rating from employees
-
Open Ticket – Total number of open tickets
-
Urgent Ticket – Total number of urgent tickets
Charts Included:
-
Resolved % – Percentage of tickets resolved
-
In Progress % – Percentage of tickets in progress
-
# Of Tickets by Ticket Status – Visual representation of ticket distribution
-
# Of Tickets by Priority Level – Low, Medium, High priority analysis
-
Open vs Urgent Tickets by Month – Compare open and urgent tickets over time
-
# Of Tickets by Department – See which department has most tickets
-
# Of Tickets by Assigned To – Performance per support agent
-
Open Tickets by Location – Track tickets based on office location
-
Avg. Satisfaction Score by Issue Type – Measure satisfaction for different issue types
This setup ensures IT managers can make data-driven decisions quickly.
Click to Buy IT Support Ticket Dashboard in Google Sheets
2. Search Sheet Tab
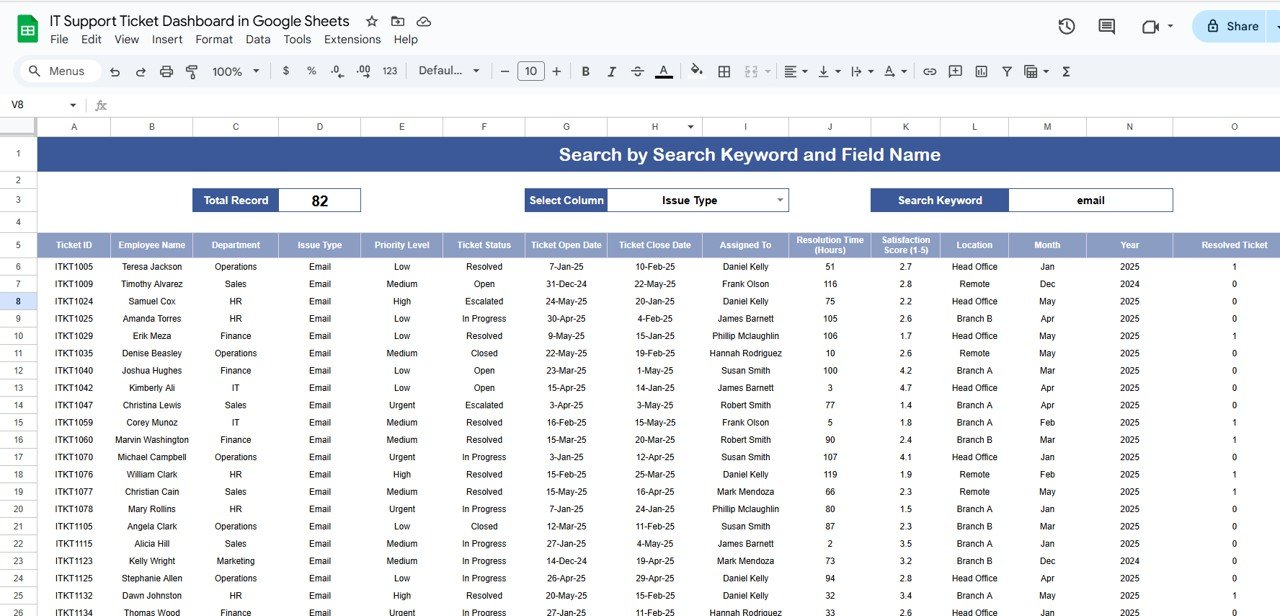
The Search Sheet allows users to filter tickets by any column and keyword.
Use Case:
-
Quickly find tickets related to specific issues, employees, departments, or dates
-
Example: Search by Issue Type “Email” to find all email-related tickets
This makes it easy to track individual tickets, identify trends, or follow up with specific cases.
Click to Buy IT Support Ticket Dashboard in Google Sheets
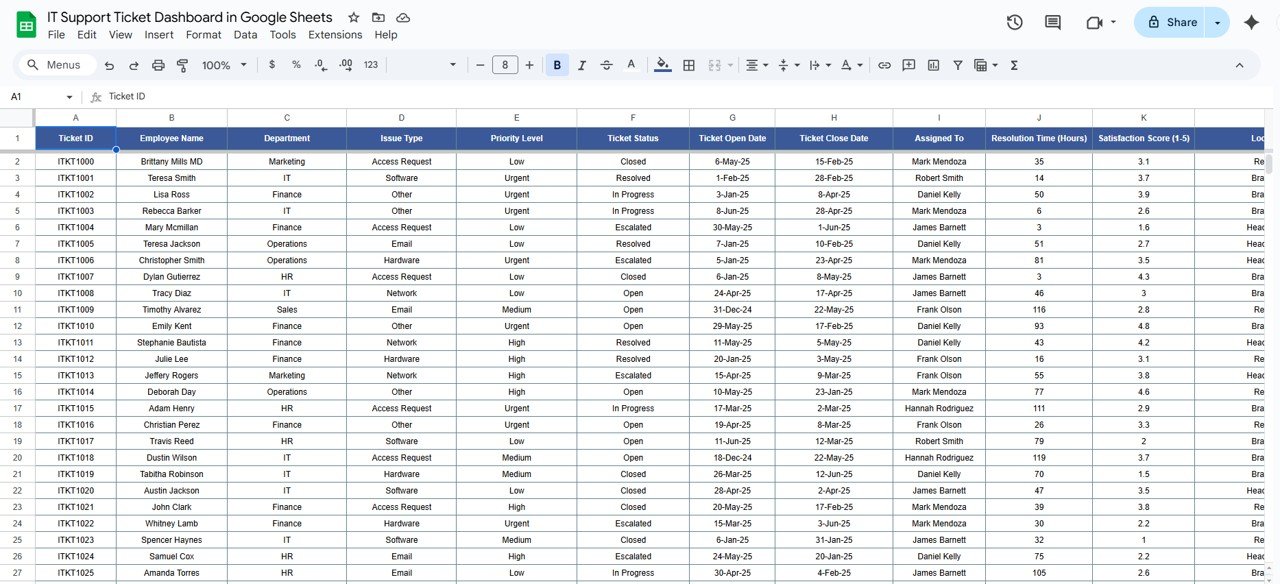
3. Data Sheet Tab
The Data Sheet is the backend input sheet where all ticket information is recorded.
All dashboard charts and metrics are dynamically linked to this data sheet, ensuring real-time updates.
Click to Buy IT Support Ticket Dashboard in Google Sheets
Advantages of Using This Dashboard
-
Comprehensive Overview: Monitor tickets, resolution times, and satisfaction scores in one place
-
Prioritization: Identify urgent tickets and high-priority issues quickly
-
Performance Tracking: Evaluate individual and team performance efficiently
-
Data-Driven Decisions: Charts and KPIs support decision-making for resource allocation
-
Easy to Use: Google Sheets interface is simple, requiring no advanced software
Opportunities for Improvement
Click to Buy IT Support Ticket Dashboard in Google Sheets
-
Automated Alerts: Integrate with email or Slack to notify support agents of urgent tickets
-
Conditional Formatting: Highlight overdue tickets automatically
-
Trend Analysis: Include monthly or quarterly trends to monitor recurring issues
-
Integration with ITSM: Connect with ticketing tools like Jira or Zendesk for automatic data updates
-
Advanced Analytics: Include pivot tables for in-depth reporting
Best Practices for Using the Dashboard
-
Update Regularly: Ensure all new tickets are logged promptly
-
Assign Responsibilities: Use the “Assigned To” column to track accountability
-
Monitor KPIs: Regularly check resolution times and satisfaction scores
-
Use Filters: Quickly analyze tickets by department, location, or issue type
-
Back Up Data: Keep a copy of the dashboard for historical reporting
Conclusion
Click to Buy IT Support Ticket Dashboard in Google Sheets
The IT Support Ticket Dashboard in Google Sheets is a powerful tool for IT teams and helpdesks to track, analyze, and optimize support ticket management. With cards, charts, and a searchable interface, IT managers can prioritize urgent issues, track team performance, and enhance employee satisfaction efficiently.
FAQs
1. Can I track multiple locations with this dashboard?
Yes, the dashboard includes an Open Tickets by Location chart for multi-office tracking.
2. How do I update ticket statuses?
Update the Ticket Status column in the Data Sheet, and all metrics and charts will update automatically.
3. Can I track ticket resolution times?
Yes, the Avg. Resolution Time (Hours) card shows the average time taken for all tickets.
4. Can multiple team members use this Google Sheet simultaneously?
Yes, Google Sheets allows multiple users to edit and view in real-time.
5. Can this dashboard integrate with other ITSM tools?
Yes, the data sheet can be exported or linked to tools like Jira, Zendesk, or ServiceNow for automation.
Visit our YouTube channel to learn step-by-step video tutorials
Youtube.com/@NeotechNavigators