Managing Logistics Cost Optimization KPI Dashboard in Google Sheets costs is one of the most important priorities for supply chain, procurement, warehousing, and distribution teams. When transport costs rise, warehouse efficiency drops, or order accuracy suffers, the entire supply chain becomes expensive and inefficient. To reduce cost leaks, improve productivity, and strengthen operational visibility, organizations need a structured system to monitor logistics KPIs.Logistics Cost Optimization KPI Dashboard in Google Sheets
The Logistics Cost Optimization KPI Dashboard in Google Sheets is a ready-to-use, data-driven tool that helps teams track monthly and yearly logistics costs, compare performance with targets, analyze trends, and optimize expenses.Logistics Cost Optimization KPI Dashboard in Google Sheets
In this article, you will learn:Logistics Cost Optimization KPI Dashboard in Google Sheets
-
The full dashboard structure
-
All key KPIs with units, formulas, definitions, and KPI type (UTB/LTB)
-
How each worksheet functions
-
Advantages, improvement opportunities, best practices
-
Frequently asked questions
What Is a Logistics Cost Optimization KPI Dashboard in Google Sheets?
Click to Buy Logistics Cost Optimization KPI Dashboard in Google Sheets
A Logistics Cost Optimization Dashboard is a performance monitoring system designed to evaluate logistics efficiency and cost effectiveness. It tracks important metrics across transportation, warehousing, delivery, freight, fleet utilization, customer orders, and operational efficiency.
With this dashboard, businesses can:
✔ Monitor monthly (MTD) and yearly (YTD) logistics performance
✔ Compare with Targets and Previous Year values
✔ Track improvements with conditional formatting
✔ Analyze trends for each KPI
✔ Build a deeper understanding of cost drivers
Since it is created in Google Sheets, it is cloud-based, highly customizable, and requires no advanced software.
Key Features of This Logistics KPI Dashboard
This dashboard has 6 worksheets, each serving a major purpose:
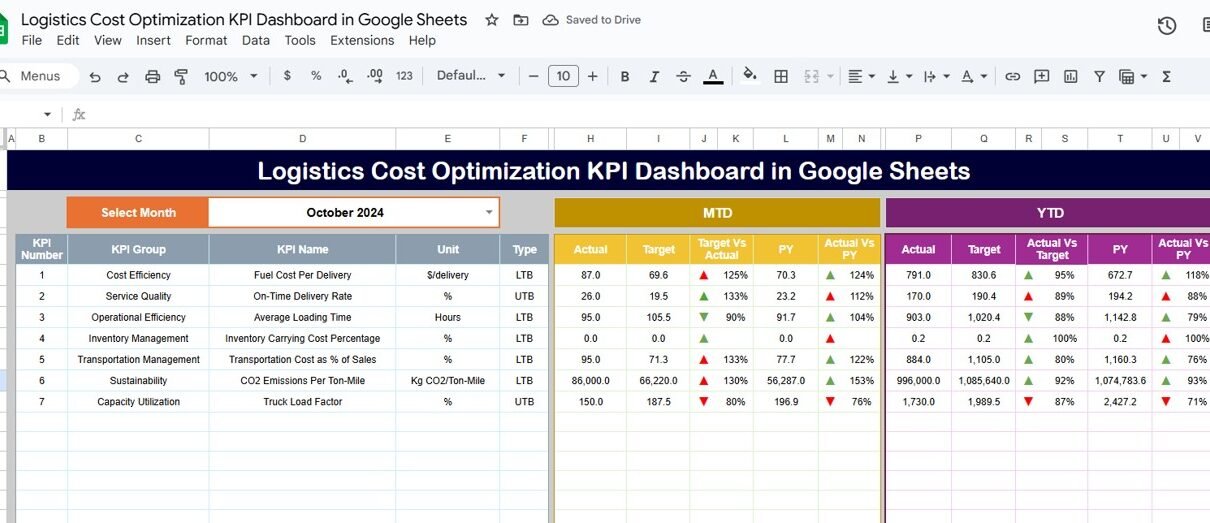
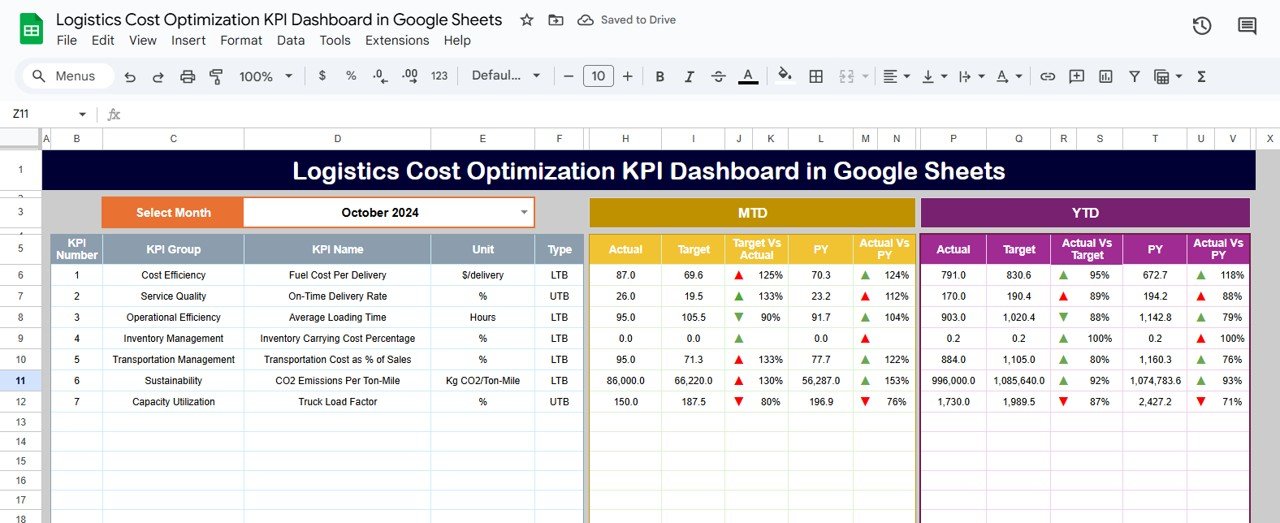
Dashboard Sheet Tab (Main KPI Dashboard)
This is the heart of the dashboard.
Features:
-
Month Dropdown (Cell D3):
Select any month to view updated KPIs -
Shows MTD Actual, Target, PY (Previous Year)
-
Shows YTD Actual, Target, Previous Year
-
Uses conditional formatting arrows:
-
Green ↑ for improvement
-
Red ↓ for decline
-
-
Helps evaluate cost optimization effectiveness instantly
Click to Buy Logistics Cost Optimization KPI Dashboard in Google Sheets
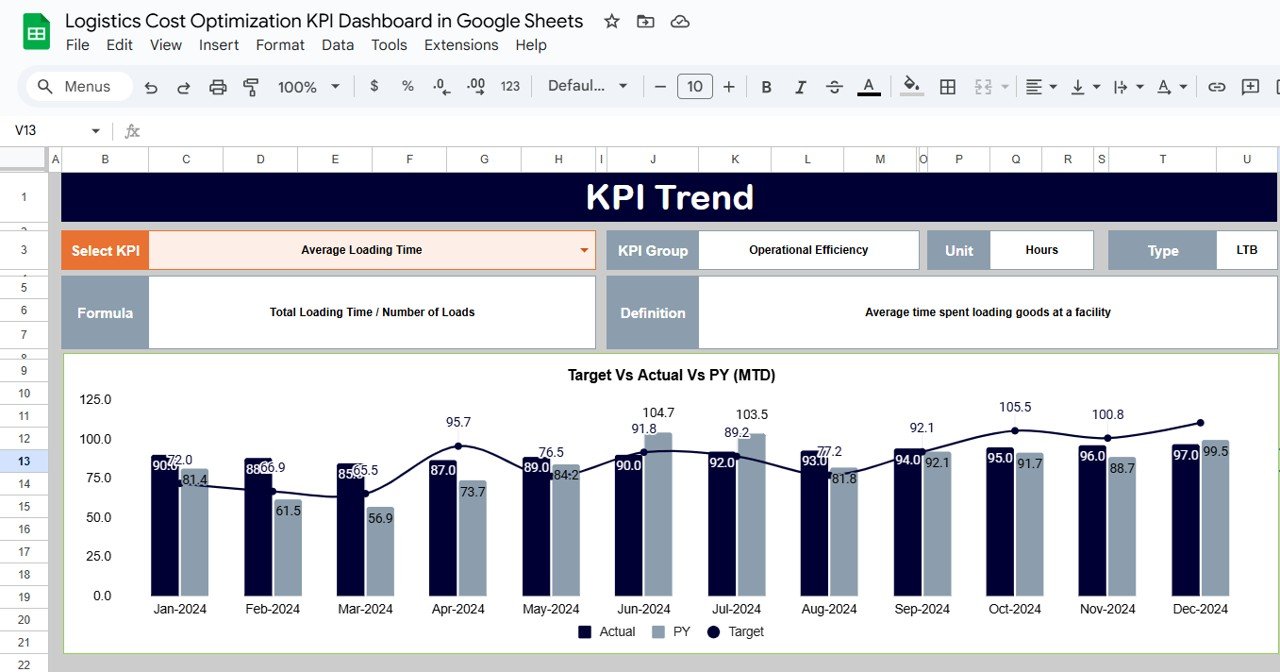
KPI Trend Sheet Tab
This sheet provides deep-dive analysis into each KPI.
Features:
-
KPI dropdown (Cell C3) to select KPI
Shows:
- KPI Group
- Unit
- Formula
- KPI Type (UTB/LTB)
- KPI Definition
Helps visualize monthly trends and performance patterns
Click to Buy Logistics Cost Optimization KPI Dashboard in Google Sheets
Actual Number Sheet Tab
Enter MTD & YTD actual numbers for each month.
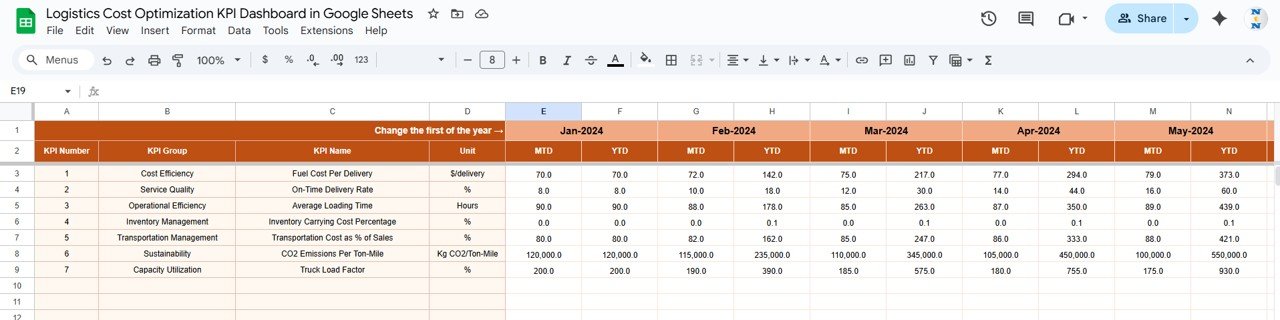
Target Sheet Tab
Enter monthly and yearly targets for each KPI.
Purpose:
-
Helps compare actual performance with expected values

Click to Buy Logistics Cost Optimization KPI Dashboard in Google Sheets
Previous Year Number Sheet Tab
Enter PY values for MTD & YTD.

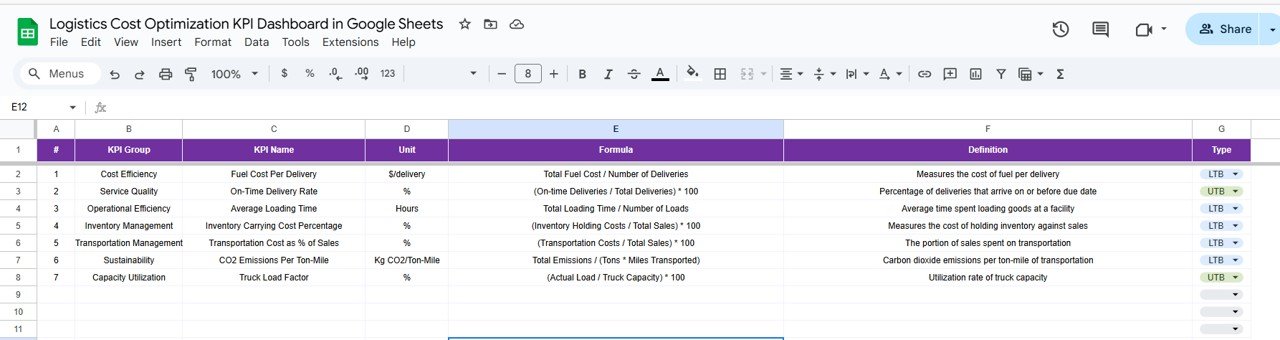
KPI Definition Sheet Tab
Contains definitions of each KPI.
Columns:
-
KPI Name
-
KPI Group
-
Unit
-
Formula
-
Definition
-
Type (UTB / LTB)
Click to Buy Logistics Cost Optimization KPI Dashboard in Google Sheets
Advantages of the Logistics KPI Dashboard
-
Real-time tracking of cost performance
-
Clear visibility of transportation, warehousing, and delivery metrics
-
Instant identification of cost leakages
-
Improved fleet and labor utilization
-
Reduces expensive logistics bottlenecks
-
Helps in monthly & yearly budgeting
-
Supports decision-making using data
-
Fully cloud-based & shareable
Opportunities for Improvement
You can enhance the dashboard with the following features:
-
AI-based cost prediction using simple forecasting formulas
-
Alerts for high logistics cost months
-
Integration with Google Forms for warehouse or transport data entry
-
Route-based cost analysis
-
Supplier delivery performance score
-
Carrier comparison dashboard
Best Practices for Logistics Cost Optimization
Click to Buy Logistics Cost Optimization KPI Dashboard in Google Sheets
-
Update actual values weekly or monthly
-
Benchmark costs against previous year values
-
Track damaged goods strictly to reduce reverse logistics cost
-
Review vehicle utilization regularly
-
Analyze fuel efficiency by vehicle type
-
Maintain accurate inventory values
-
Ensure uniform naming for all logistics entities
Conclusion
The Logistics Cost Optimization KPI Dashboard in Google Sheets gives complete visibility into logistics operations, enabling businesses to reduce costs and improve service levels. The dashboard’s KPI-driven structure helps supply chain teams focus on the right areas — transportation, warehousing, fleet performance, fulfillment efficiency, and quality.
Visit our YouTube channel to learn step-by-step video tutorials
Youtube.com/@NeotechNavigators
Watch the step-by-step video Demo:
Click to Buy Logistics Cost Optimization KPI Dashboard in Google Sheets