In today’s competitive luxury retail environment, tracking key performance indicators (KPIs) is essential for operational efficiency, sales optimization, and strategic decision-making. The Luxury Retail KPI Dashboard in Google Sheets is a ready-to-use template designed to help retail managers, store owners, and analysts monitor performance across multiple metrics in real-time.
This dashboard brings together data visualization, trend analysis, and KPI tracking in a single, easy-to-use platform.
Key Features of the Luxury Retail KPI Dashboard
This dashboard comes with 6 prebuilt worksheets, each serving a specific function to help you monitor and manage luxury retail performance effectively.
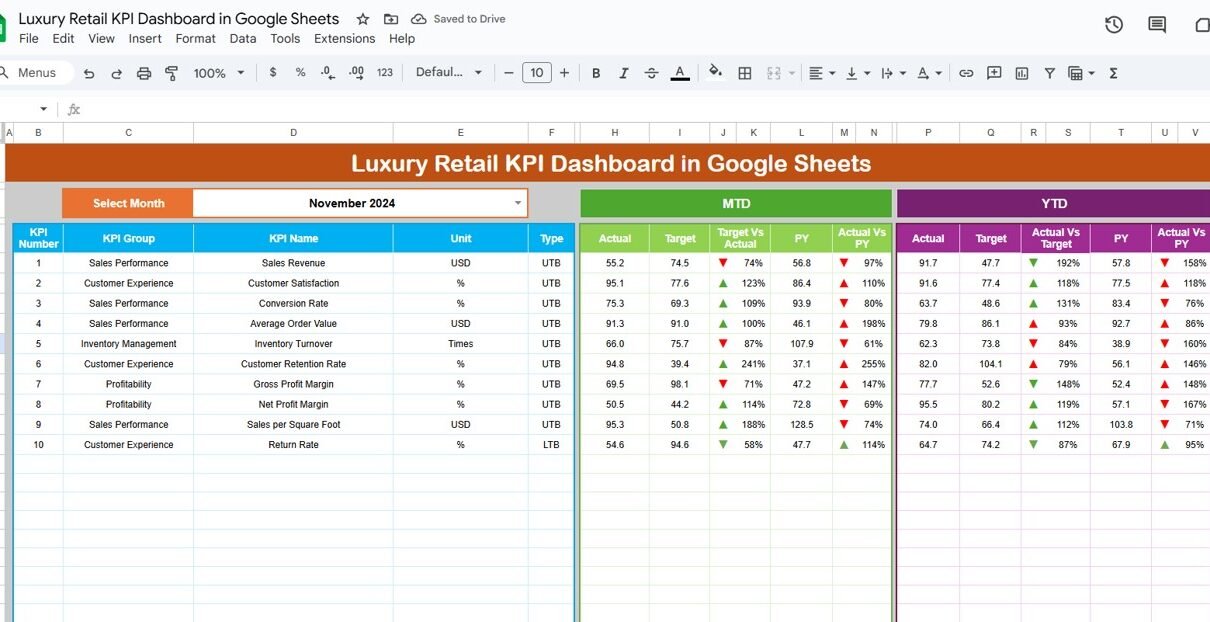
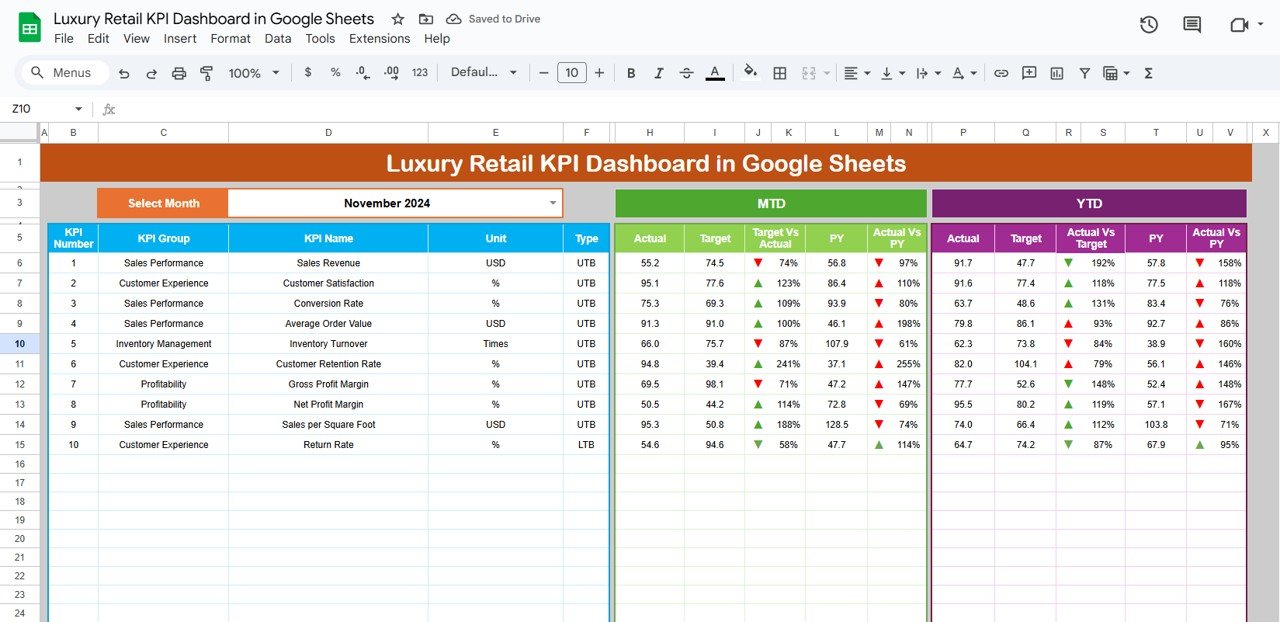
1. Dashboard Sheet Tab
This is the main sheet of the dashboard. Here you can view all key performance metrics in a concise, visual format.
Features include:
-
Month Selection: Change the month from the drop-down menu in Range D3, and the entire dashboard updates automatically.
-
MTD and YTD Metrics: Display Month-to-Date (MTD) and Year-to-Date (YTD) Actuals, Targets, and Previous Year values.
-
Conditional Formatting: Visual cues such as up/down arrows to indicate performance against targets.
-
Comparison Views: Evaluate Target vs Actual and PY vs Actual for both MTD and YTD.
-
Cards and Charts: Quick insights into top KPIs, including sales revenue, customer traffic, conversion rates, and more.
Click to Buy Luxury Retail KPI Dashboard in Google Sheets
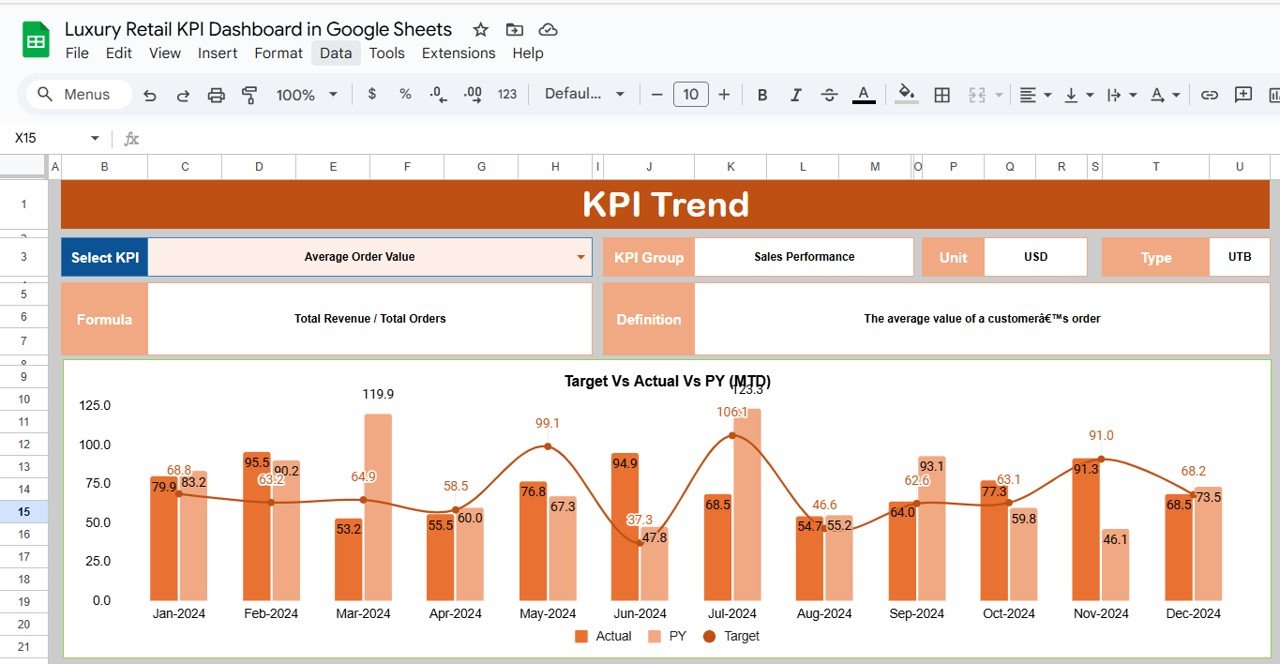
2. KPI Trend Sheet Tab
The KPI Trend sheet allows you to analyze the trend of individual KPIs over time.
Features include:
-
Dropdown Selection: Choose any KPI from Range C3 to see detailed insights.
-
KPI Information Display: Shows KPI Group, Unit, Type (Lower the Better / Upper the Better), Formula, and Definition.
-
Trend Charts: Visualize monthly or quarterly trends to identify patterns, areas for improvement, and successes.
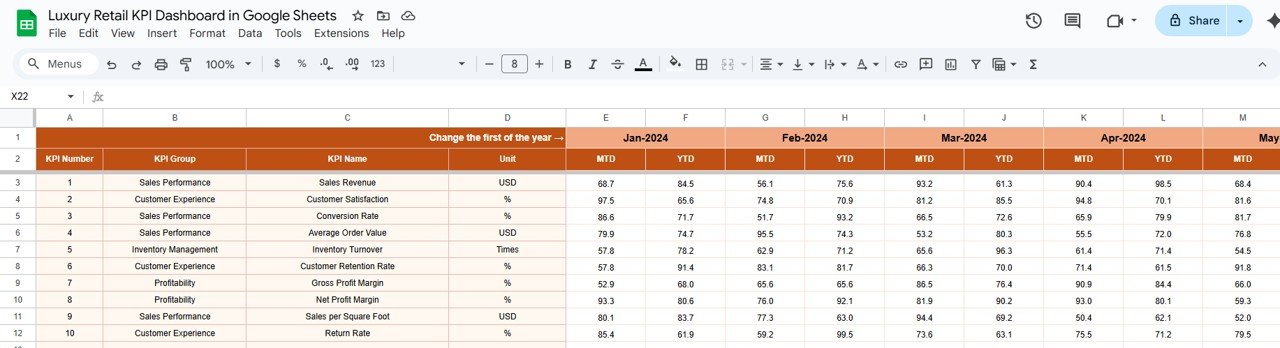
3. Actual Numbers Sheet Tab
This sheet allows you to enter the actual recorded data for each KPI.
Features include:
-
MTD and YTD Inputs: Enter values for each month, and the dashboard automatically updates.
-
Dynamic Month Selection: Change the first month of the year in Range E1 to adjust the reporting period.
-
Data-Driven Insights: Supports pivot tables and charts for deeper analysis.
Click to Buy Luxury Retail KPI Dashboard in Google Sheets
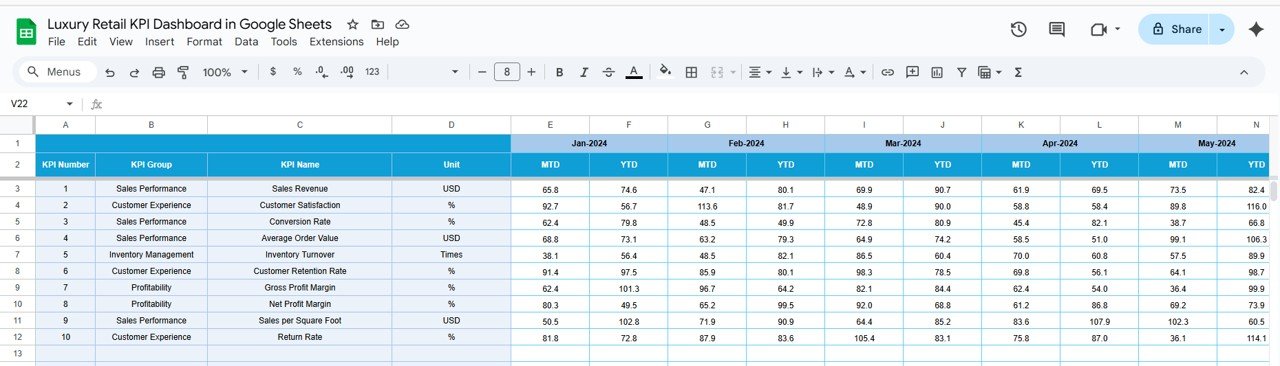
4. Target Sheet Tab
This sheet is used to input target values for all KPIs.
Features include:
-
MTD and YTD Targets: Set monthly targets and cumulative yearly targets for each KPI.
-
Alignment with Dashboard: Targets are used to calculate performance vs goal on the Dashboard sheet.
-
Customizable Metrics: Easily adjust targets based on business goals or seasonal trends.
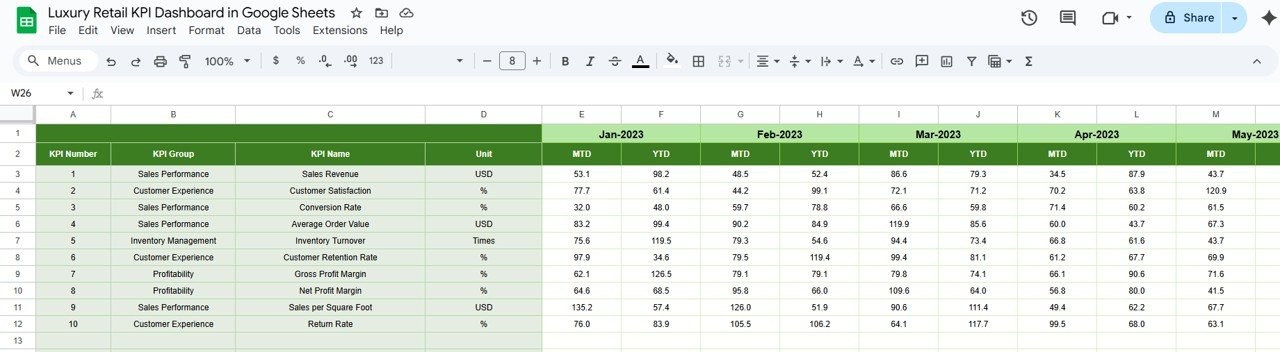
5. Previous Year Numbers Sheet Tab
The Previous Year sheet provides context for performance comparison.
Features include:
-
Historical Data: Input last year’s values for each KPI.
-
Performance Benchmarking: Compare current performance against the previous year to identify growth areas or declines.
-
Supports Conditional Formatting: Helps highlight positive or negative trends.
Click to Buy Luxury Retail KPI Dashboard in Google Sheets
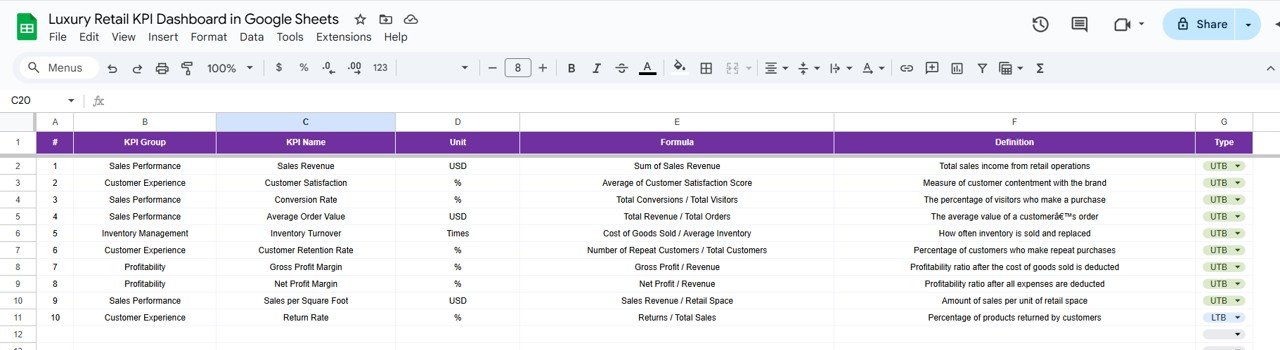
6. KPI Definition Sheet Tab
The KPI Definition sheet acts as a reference for all KPIs in your dashboard.
Features include:
-
KPI Name and Group: Organize KPIs by category such as Sales, Customer Experience, or Operational Efficiency.
-
Unit and Formula: Specify the unit of measurement and calculation formula.
-
KPI Type: Indicate whether “Lower the Better” (LTB) or “Upper the Better” (UTB).
-
Definition: Provide a short explanation for clarity and consistency.
Advantages of Using This Dashboard
Click to Buy Luxury Retail KPI Dashboard in Google Sheets
-
Consolidates multiple KPIs in one sheet for easy monitoring
-
Tracks MTD, YTD, and year-over-year performance
-
Provides visual insights using charts, trendlines, and conditional formatting
-
Allows customization of KPIs, targets, and formulas
-
Supports proactive decision-making in luxury retail operations
Opportunities for Improvement
-
Can be integrated with live POS or CRM systems for automatic data updates
-
Add regional or store-level filters for multi-store chains
-
Include additional KPIs like Net Promoter Score or Customer Retention Rate
Best Practices
Click to Buy Luxury Retail KPI Dashboard in Google Sheets
-
Update actual and target values regularly to maintain accuracy
-
Use conditional formatting to quickly spot KPI gaps
-
Review historical trends to inform future targets and operational decisions
-
Share dashboard with team members for collaborative decision-making
Conclusion
The Luxury Retail KPI Dashboard in Google Sheets is an essential tool for retail managers and analysts seeking a clear, actionable view of business performance. By centralizing KPIs, comparing them to targets and previous year data, and visualizing trends, this dashboard empowers strategic decisions to drive growth and efficiency in luxury retail operations.
Visit our YouTube channel to learn step-by-step video tutorials
Youtube.com/@NeotechNavigators