The maritime industry operates in a highly complex and performance-driven environment. Shipping companies, port authorities, logistics operators, and maritime service providers continuously manage vessel operations, fuel efficiency, turnaround time, safety compliance, and operational costs. However, many organizations still rely on manual reports and disconnected spreadsheets to monitor performance.
As a result, decision-makers struggle to evaluate operational efficiency quickly. Therefore, businesses need a structured and automated way to track maritime performance indicators.
The Maritime KPI Scorecard in Google Sheets provides a ready-to-use solution that helps organizations monitor key maritime metrics using an interactive and automated KPI scorecard. Instead of manually calculating performance every month, users can instantly analyze Monthly-To-Date (MTD) and Year-To-Date (YTD) results through dynamic reporting.
In this complete guide, you will learn everything about the Maritime KPI Scorecard in Google Sheets, including features, KPI structure, benefits, best practices, and practical applications.
What Is a Maritime KPI Scorecard in Google Sheets?
Click to Buy SEO Maritime KPI Scorecard In Google Sheets
A Maritime KPI Scorecard is a performance monitoring system designed to track operational, financial, and efficiency metrics within maritime operations.
This ready-to-use Google Sheets template allows users to:
- Track multiple KPIs in one place
- Monitor monthly and yearly performance
- Compare actual results with targets
- Visualize performance using traffic lights and indicators
- Analyze KPI trends dynamically
Because Google Sheets works in the cloud, teams can collaborate and update performance data in real time.
Why Does the Maritime Industry Need a KPI Scorecard?
Maritime operations involve multiple moving components such as vessels, ports, crews, cargo, and schedules. Without structured monitoring, organizations cannot identify inefficiencies quickly.
A KPI scorecard helps maritime organizations:
- Improve operational efficiency
- Reduce operational delays
- Monitor fuel and cost performance
- Ensure safety compliance
- Support data-driven decisions
Therefore, companies gain better control over daily operations and long-term performance.
Key Features of Maritime KPI Scorecard in Google Sheets
Click to Buy SEO Maritime KPI Scorecard In Google Sheets
The Maritime KPI Scorecard is a ready-to-use template designed for simplicity and automation.
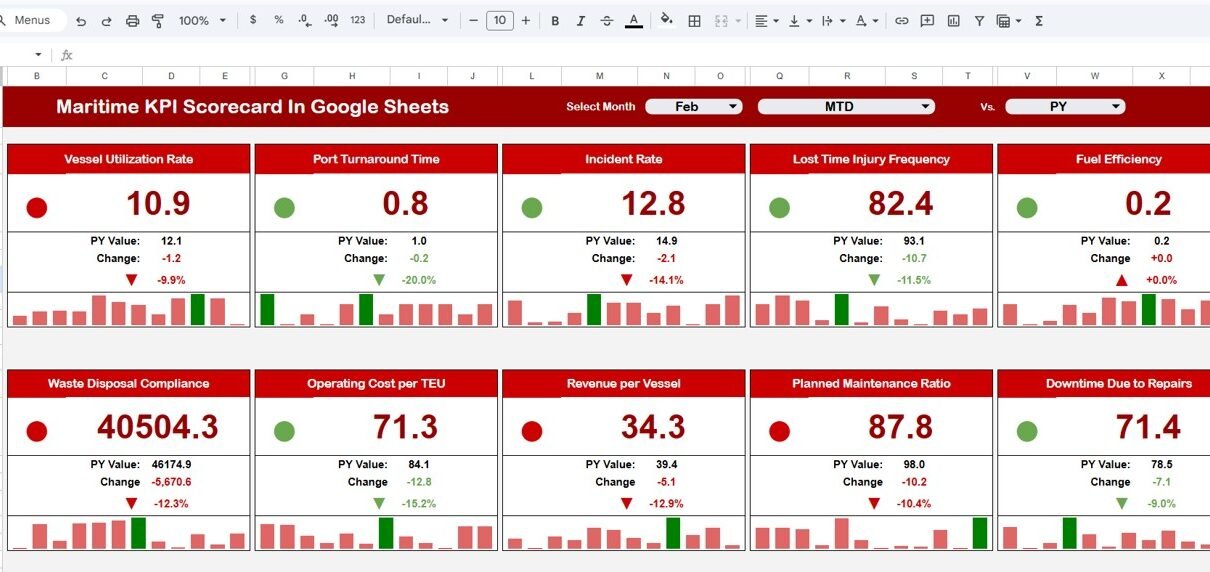
Monthly KPI Scorecard with Dynamic Selection
At the top of the dashboard, users can select a month from the dropdown.
Once selected:
- All KPI values update automatically
- Traffic light indicators change dynamically
- Percentage change arrows update instantly
- Monthly performance becomes visible immediately
Users can switch months anytime to analyze different reporting periods.
MTD and YTD Performance View
The scorecard includes two performance modes:
-
MTD (Month-To-Date) → Shows monthly performance
-
YTD (Year-To-Date) → Shows yearly cumulative performance
Users simply click MTD or YTD to switch views. Consequently, decision-makers compare short-term and long-term performance easily.
Traffic Light Performance Indicators
The dashboard uses visual indicators to simplify analysis:
-
🟢 Green → KPI performing well
-
🟡 Yellow → Needs attention
-
🔴 Red → Performance below expectations
Additionally, up and down arrows display percentage changes, allowing quick performance evaluation.
Worksheets Included in Maritime KPI Scorecard
The template contains multiple structured worksheets for organized analysis.
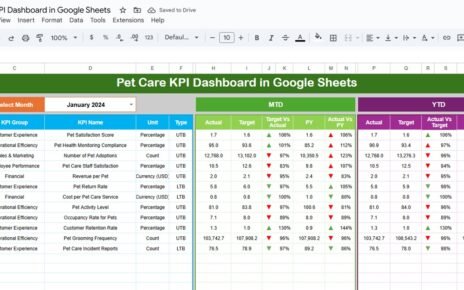
1. Dashboard Sheet – Main Performance Overview
This sheet displays the overall KPI performance summary.
It includes:
- 10 maritime KPIs
- Month selection dropdown
- KPI performance comparison
- Traffic light indicators
- Percentage change arrows
- MTD and YTD toggle buttons
Because everything appears in one view, managers quickly understand operational health.

Click to Buy SEO Maritime KPI Scorecard In Google Sheets
2. Trend Sheet Tab – KPI Performance Analysis
The Trend Sheet allows deeper KPI evaluation.
KPI Selection
Users select a KPI from dropdown range C3.
Once selected, the sheet displays:
-
KPI Group
-
KPI Unit
-
KPI Type
-
Performance Direction:
-
Lower the Better
-
Upper the Better
-
-
KPI Formula
-
KPI Definition
This structure helps teams understand how each KPI works and why it matters.

Click to Buy SEO Maritime KPI Scorecard In Google Sheets
3. KPI Definition Sheet Tab – KPI Documentation
This sheet acts as a reference library.
Users enter:
- KPI Name
- KPI Group
- Unit of Measurement
- KPI Formula
- KPI Definition
Because definitions remain centralized, reporting stays consistent across teams.

4. Data Input Sheet Tab – Performance Data Entry
This sheet allows users to input operational data.
Users simply:
- Enter KPI values
- Update monthly numbers
- Maintain historical records
After entering data, the dashboard updates automatically without manual calculations

Click to Buy SEO Maritime KPI Scorecard In Google Sheets
5. Colour Settings Sheet – Visual Configuration
The Colour Settings sheet controls dashboard formatting.
Users can define:
- Traffic light thresholds
- Performance color rules
- Indicator behavior

Click to Buy SEO Maritime KPI Scorecard In Google Sheets
Advantages of Maritime KPI Scorecard in Google Sheets
Centralized Performance Monitoring
-
Track all KPIs in one dashboard
-
Reduce reporting complexity
-
Improve visibility
Automated Reporting
-
Dynamic month selection
-
Automatic calculations
-
Instant updates
Faster Decision-Making
-
Visual performance indicators
-
Quick comparison analysis
-
Easy performance tracking
Improved Operational Efficiency
-
Identify delays quickly
-
Monitor costs effectively
-
Optimize vessel performance
Cloud Collaboration
-
Multi-user access
-
Real-time updates
-
Secure sharing
Best Practices for Maritime KPI Scorecard
Click to Buy SEO Maritime KPI Scorecard In Google Sheets
Define Clear KPI Targets
Set measurable and realistic performance goals.
Update Data Consistently
Maintain monthly data accuracy.
Monitor Trends Regularly
Analyze long-term patterns, not just single months.
Customize Performance Thresholds
Adjust traffic light settings based on business needs.
Train Teams on KPI Definitions
Ensure everyone understands performance metrics.
How Does This Scorecard Improve Strategic Planning?
The scorecard helps leaders:
- Identify operational bottlenecks
- Reduce costs
- Improve scheduling efficiency
- Enhance safety compliance
- Increase profitability
Therefore, decision-making becomes proactive rather than reactive.
Conclusion
Click to Buy SEO Maritime KPI Scorecard In Google Sheets
The Maritime KPI Scorecard in Google Sheets offers a powerful and easy-to-use solution for monitoring maritime performance. With dynamic month selection, automated KPI calculations, traffic light indicators, and trend analysis, organizations gain complete visibility into operational efficiency.
By combining structured KPIs with interactive reporting, maritime companies improve performance tracking, optimize operations, and support smarter strategic decisions.
Ultimately, this ready-to-use template transforms complex maritime data into clear, actionable insights.
Frequently Asked Questions (FAQs)
What is a Maritime KPI Scorecard?
It is a performance monitoring tool that tracks operational and financial maritime metrics using structured KPIs.
Why use Google Sheets for KPI tracking?
Google Sheets enables real-time collaboration, automation, and easy accessibility without expensive software.
What is the difference between MTD and YTD?
MTD shows monthly performance, while YTD shows cumulative yearly performance.
Can this scorecard be customized?
Yes. Users can modify KPIs, formulas, and color settings.
Who should use this template?
Shipping companies, port authorities, logistics managers, and maritime analysts benefit most.
Visit our YouTube channel to learn step-by-step video tutorials
Youtube.com/@NeotechNavigators
Watch the step-by-step video tutorial: