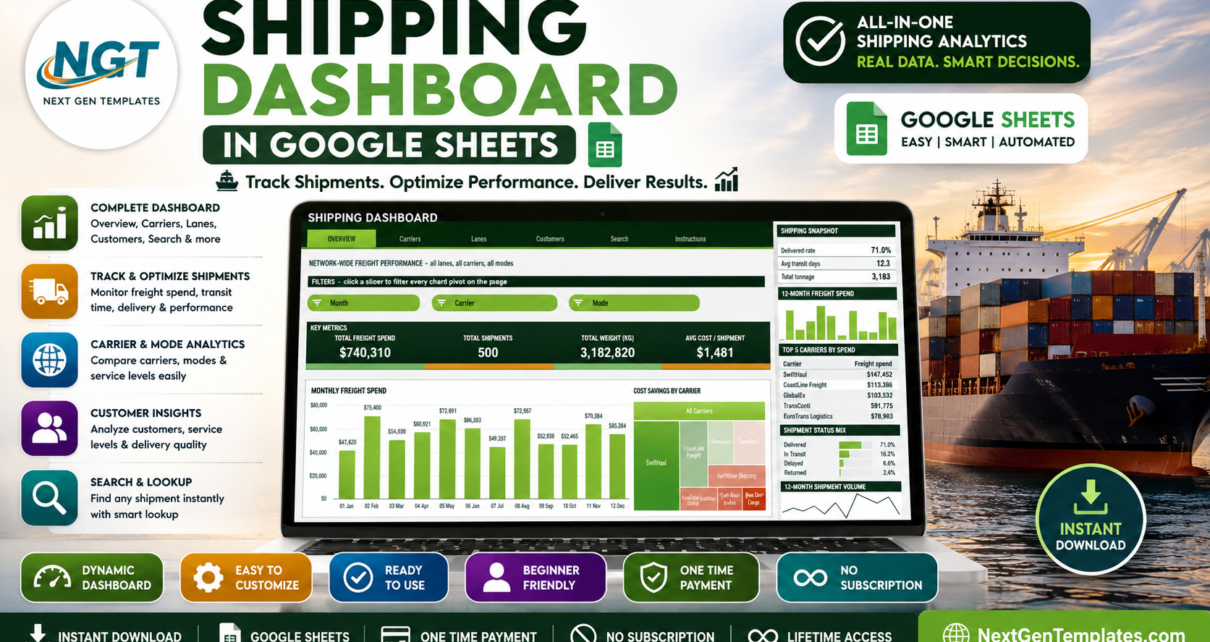
A five-page Shipping Dashboard in Google Sheets built on native pivot tables and slicers – freight spend, carrier mix, trade lanes, customer delivery quality and a shipment-ID lookup, with 500 sample shipments loaded and room for 1,000 rows.
Online Tutorial for Data Analysis and Automation
A five-page Shipping Dashboard in Google Sheets built on native pivot tables and slicers – freight spend, carrier mix, trade lanes, customer delivery quality and a shipment-ID lookup, with 500 sample shipments loaded and room for 1,000 rows.
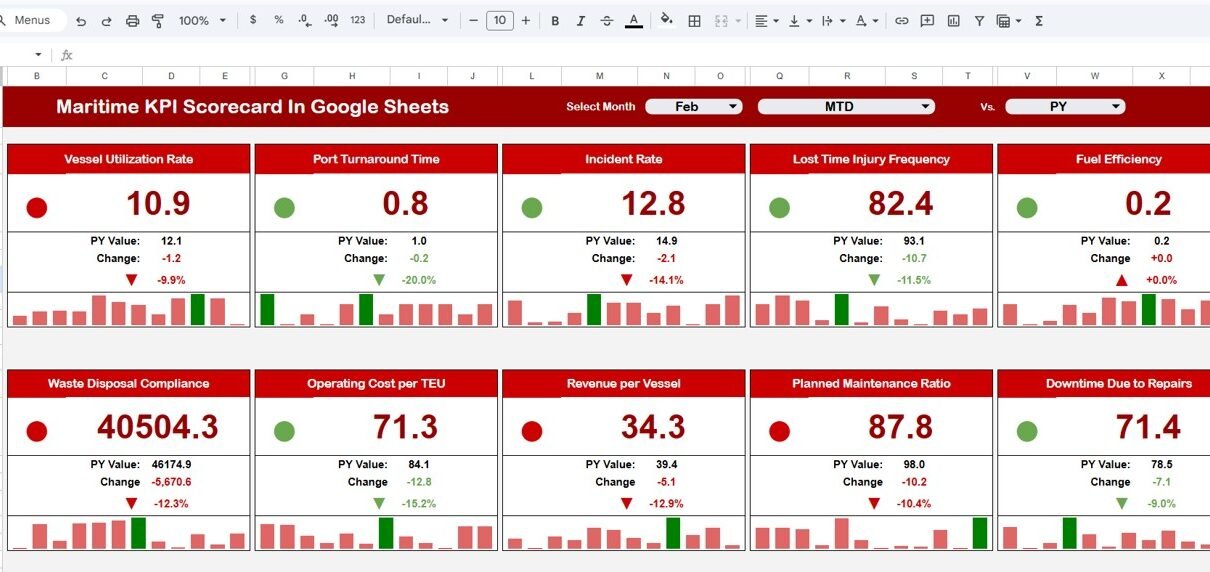
The maritime industry operates in a highly complex and performance-driven environment. Shipping companies, port authorities, logistics operators, and maritime service providers continuously manage vessel operations, fuel efficiency, turnaround time, safety compliance, and operational costs. However, many organizations still rely on manual reports and disconnected spreadsheets to monitor performance. As a result, decision-makers struggle to evaluate […]