Effective media buying is crucial for the success of advertising campaigns. Whether you are managing digital ads, television spots, or print media, tracking key performance indicators (KPIs) can help you optimize your campaigns and maximize ROI. The Media Buying KPI Dashboard in Google Sheets is an essential tool for tracking the success of your media campaigns in real-time.
In this article, we will explore the Media Buying KPI Dashboard in Google Sheets, its features, and how it can help media buyers monitor performance and make data-driven decisions.
What is the Media Buying KPI Dashboard in Google Sheets?
The Media Buying KPI Dashboard in Google Sheets is a dynamic tool designed to help media buyers track key metrics related to advertising campaigns. It allows you to monitor important KPIs, such as impressions, clicks, conversions, cost per click (CPC), and return on investment (ROI). By tracking these KPIs, media buyers can make informed decisions to improve campaign performance.
The dashboard contains six main worksheets, each dedicated to tracking and displaying different KPIs and performance metrics. It is fully interactive and customizable, with options to filter data by month and compare it against targets and previous year data.
Key Features of the Media Buying KPI Dashboard in Google Sheets
This dashboard is organized into six worksheets, each focusing on a specific aspect of media buying performance. Below are the key features of each worksheet:
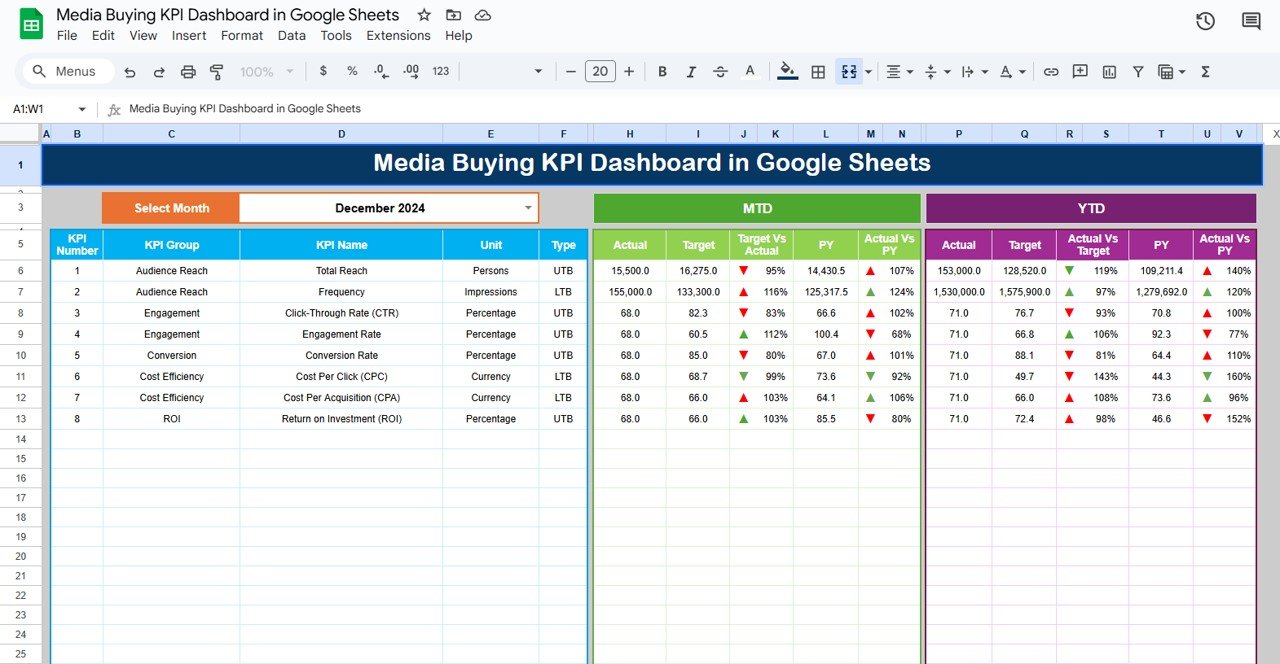
1. Dashboard Sheet Tab
The Dashboard Sheet provides a high-level overview of all the key performance indicators for media buying campaigns. Key features include:
MTD (Month-to-Date) and YTD (Year-to-Date) Metrics:
- MTD Actual: Displays the actual data for the current month.
- MTD Target: Shows the target values for the current month.
- PY vs Actual: Compares the current month’s data with the same period from the previous year (PY).
- YTD Actual: Cumulative data for the year.
- YTD Target vs Actual: Compares the YTD target with actual performance for the year.
- Conditional Formatting: Arrows (up or down) show whether the performance is above or below the target and PY data.
Click to buy Media Buying KPI Dashboard in Google Sheets
2. KPI Trend Sheet Tab
The KPI Trend Sheet helps you track the performance of individual KPIs over time, allowing you to identify trends and adjust strategies accordingly.
KPI Selection Dropdown:
In C3, you can select a KPI, and the sheet will display:
- KPI Group: The category of the KPI (e.g., impressions, clicks, conversions).
- Unit of KPI: The unit of measurement for the KPI (e.g., dollars, percentage, number of clicks).
- Type of KPI: Whether the KPI is “Lower the Better” or “Upper the Better.”
- Formula of KPI: The formula used to calculate the KPI.
- KPI Definition: A description of what each KPI measures and its relevance to media buying.

3. Actual Number Sheet Tab
The Actual Number Sheet is where you input the actual data for MTD and YTD. This data updates the dashboard and provides real-time insights into campaign performance.
-
Data Entry:
Enter the actual data for each KPI for the selected month (indicated in E1). The dashboard will automatically update with the latest performance metrics.

Click to buy Media Buying KPI Dashboard in Google Sheets
4. Target Sheet Tab
The Target Sheet allows you to set the target values for each KPI, both MTD and YTD. This is essential for comparing actual performance with the goals you set for your campaign.
-
Data Entry:
Input the target values for each KPI, and compare them with actual performance in the Dashboard Sheet.

Click to buy Media Buying KPI Dashboard in Google Sheets
5. Previous Year Number Sheet Tab
The Previous Year Number Sheet stores data from the previous year, allowing you to compare current performance with historical data.
-
Data Entry:
Enter last year’s data for each KPI to track performance improvements or declines over time.

6. KPI Definition Sheet Tab
The KPI Definition Sheet contains definitions and formulas for each KPI, ensuring clarity in what each metric tracks.
-
KPI Definitions:
Each KPI is clearly defined by its name, group, unit, formula, and an explanation of what it measures and why it’s important for media buying campaigns.
-

KPI Definition Sheet Tab
Advantages of Using the Media Buying KPI Dashboard
-
Comprehensive Media Buying Tracking:Track all critical KPIs related to media buying, from impressions and clicks to conversions and ROI, in one place.
-
Real-Time Insights:The dashboard provides real-time updates based on the data entered, ensuring that your media buying performance is always up to date.
-
Customizable for Your Needs:The template is highly customizable, allowing you to adjust KPIs, add new ones, or modify the dashboard layout to suit your specific media buying goals.
-
Data-Driven Decision Making:The dashboard helps you make data-driven decisions by providing clear insights into key performance metrics such as CPC, CTR, ROI, and more.
-
Visual Feedback:The charts, conditional formatting, and KPI comparisons provide clear visual feedback, making it easy to track performance and identify areas for improvement.
Best Practices for Using the Media Buying KPI Dashboard
Click to buy Media Buying KPI Dashboard in Google Sheets
-
Update Data Regularly:Ensure that data is entered consistently and updated regularly to maintain an accurate and up-to-date dashboard.
-
Monitor Key KPIs:Regularly track key KPIs such as CPC, CTR, and Conversion Rate to ensure your media buying strategies are delivering the desired results.
-
Leverage Insights for Optimization:Use the insights from the KPI Trend Sheet to identify trends and optimize future media buying campaigns for maximum ROI.
-
Adjust Strategies Based on Data:Use the data in the dashboard to adjust your media buying strategies, whether that means reallocating budget, adjusting targeting, or refining your ad creatives.
Frequently Asked Questions (FAQs)
Click to buy Media Buying KPI Dashboard in Google Sheets
1. How do I update the Media Buying KPI Dashboard?
Simply enter the latest data for each KPI in the Actual Number Sheet, and the dashboard will automatically update with the new performance metrics.
2. Can I track multiple campaigns with this dashboard?
Yes, the template is customizable to track multiple campaigns or media channels by adding additional columns or modifying the layout.
3. How do I compare current performance with previous years?
Enter last year’s data in the Previous Year Number Sheet to compare it with the current year’s performance and track your progress.
Conclusion
The Media Buying KPI Dashboard in Google Sheets is an essential tool for tracking and optimizing your media buying campaigns. With real-time insights into key metrics like CTR, CPC, ROI, and SLA Breach Rate, the dashboard provides actionable data that helps you make informed decisions and optimize your campaigns. Whether you’re managing a small ad budget or a large media buying strategy, this dashboard helps you stay organized and on track to achieve your goals.
Visit our YouTube channel to learn step-by-step video tutorials
Youtube.com/@NeotechNavigators
Watch the step-by-step video Demo: