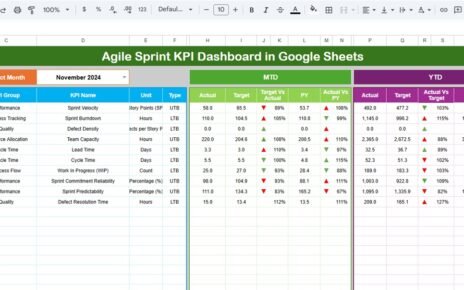
Effective media planning requires real-time monitoring of campaign performance, budget efficiency, impressions, reach, and ROI. The Media Planning KPI Dashboard in Google Sheets provides a ready-to-use solution that helps marketing teams, agencies, and advertisers track every key media metric in one place.
Media Planning KPI Dashboard in Google Sheets
This dashboard brings clarity to campaign performance and allows users to evaluate media spend, engagement, conversions, and cost effectiveness using automated KPIs and visual charts.
What Is a Media Planning KPI Dashboard in Google Sheets?
The Media Planning KPI Dashboard is a centralized performance-tracking tool designed to monitor media spend, campaign outcomes, engagement, and ROI.
Media Planning KPI Dashboard in Google Sheets
It visualizes monthly and yearly performance, compares target vs actual results, and highlights whether campaigns are improving or falling behind expectations.
Using this dashboard, marketing teams get instant insights into impressions, reach, CPM, CPC, conversions, and budget utilization.
Dashboard Structure
Click to Buy Media Planning KPI Dashboard in Google Sheets
This Google Sheets dashboard contains 6 worksheets, each focusing on a different part of media performance tracking.
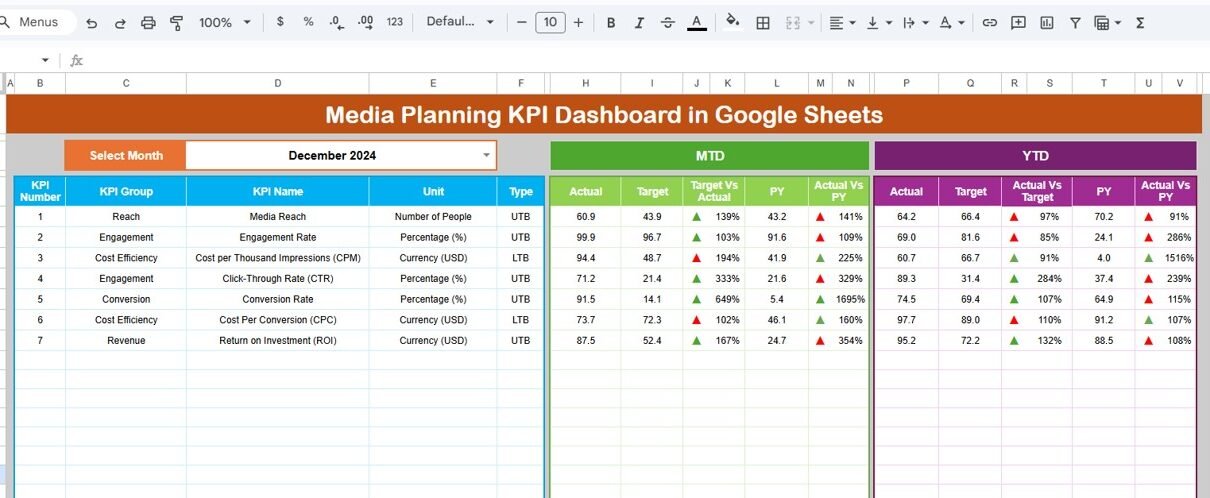
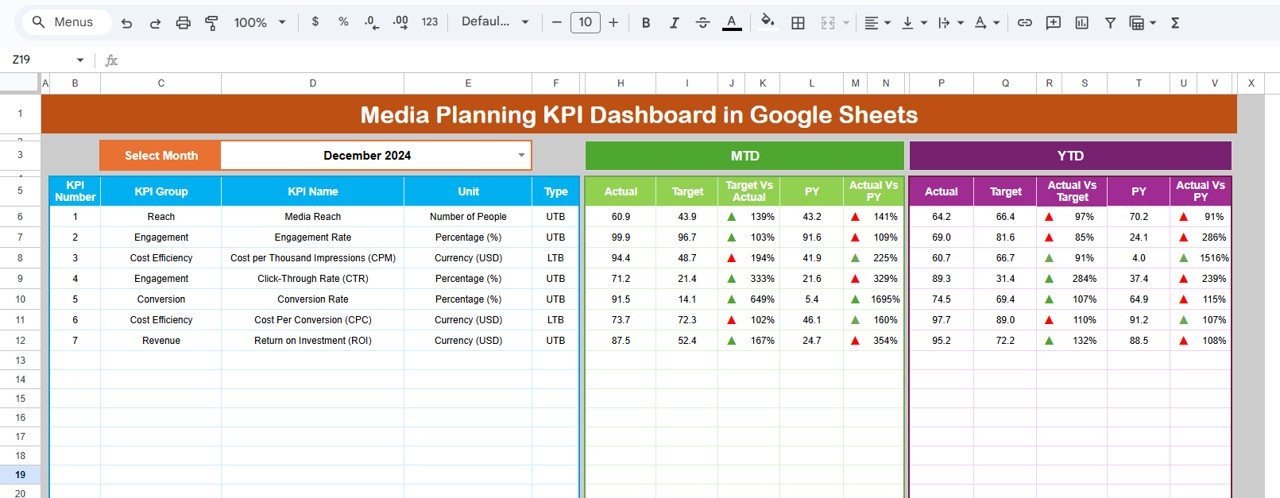
2: Dashboard Sheet Tab
This is the main control center of the dashboard.
Key Features:
-
Month selection available in Range D3
-
Entire dashboard updates automatically for selected month
-
Displays MTD Actual, Target, Previous Year, Target vs Actual, PY vs Actual
-
Conditional formatting with Green ↑ and Red ↓ indicators
-
Shows YTD Actual, Target, Previous Year, and comparisons
This sheet provides an at-a-glance summary of all media KPIs.
Click to Buy Media Planning KPI Dashboard in Google Sheets
3: KPI Trend Sheet Tab
This tab allows detailed analysis of a single KPI.
Key Features:
-
Select KPI via dropdown in Range C3
-
Shows KPI Group, Unit, KPI Type (UTB/LTB), Formula, and Definition
-
Displays graphical trends for MTD & YTD performance
-
Helps identify whether a KPI is improving or declining
It is ideal for deep KPI-level insights and strategic planning.

4: Actual Number Sheet Tab
This sheet stores the actual monthly data.
Key Features:
-
Enter MTD and YTD actual values for each KPI
-
Change starting month in Range E1
-
Supports dynamic data updates
-
Feeds real-time values into all dashboard charts
This ensures accurate monthly reporting.’

Click to Buy Media Planning KPI Dashboard in Google Sheets
5: Target Sheet Tab
This sheet contains target values for each KPI.
Key Features:
-
Enter monthly MTD and YTD targets
-
Perfect for planning and yearly goal setting
-
Allows performance comparison with targets
-
Ensures departments align with quarterly goals

6: Previous Year Number Sheet Tab
This sheet holds last year’s KPI numbers.
Key Features:
-
Structure identical to current year
-
Enables YoY growth comparison
-
Useful for evaluating long-term performance
-
Helps set realistic targets

Click to Buy Media Planning KPI Dashboard in Google Sheets
7: KPI Definition Sheet Tab
This sheet includes complete KPI definitions, such as:
-
KPI Name
-
KPI Group
-
Unit
-
Formula
-
Definition
-
Type (Lower the Better / Upper the Better)
Below is the complete KPI list for your Media Planning Dashboard.

Advantages of Media Planning KPI Dashboard in Google Sheets
📊 Real-Time Media Performance Tracking
Measure impressions, clicks, conversions, and ROI instantly.
💰 Cost Efficiency Insights
Track CPM, CPC, CPA, and budget utilization.
⚡ Smart Visual Breakdown
Easy-to-read charts for month-wise and year-wise reporting.
🎯 Target vs Actual Comparison
Instant view of whether campaigns met KPIs.
☁️ Cloud-Based Collaboration
Update, share, and analyze anywhere using Google Sheets.
Opportunities for Improvement
Click to Buy Media Planning KPI Dashboard in Google Sheets
-
Add platform-level breakdown (Facebook, Google, YouTube, etc.)
-
Include creative performance charts
-
Add conversion funnel visualization
-
Integrate Google Ads API for auto-updates
-
Add demographic metrics (gender, region, age group)
Best Practices
-
Update actual numbers daily or weekly
-
Review ROAS and CPA monthly
-
Track CTR to identify low-performing creatives
-
Keep media frequency in optimal range
-
Compare current spend with last year before budgeting
Conclusion
Click to Buy Media Planning KPI Dashboard in Google Sheets
The Media Planning KPI Dashboard in Google Sheets gives marketing teams a powerful tool to evaluate campaign effectiveness, cost efficiency, and audience reach. With automated KPIs, monthly trends, and target comparisons, this dashboard simplifies decision-making and helps optimize media strategy for better results.
Visit our YouTube channel to learn step-by-step video tutorials
Youtube.com/@NeotechNavigators
Watch the step-by-step video Demo: