In today’s data-driven world, having a well-organized sales report and tracker is essential for businesses to understand performance and make informed decisions. Google Sheets provides an excellent platform to create monthly sales reports, thanks to its user-friendly features and cloud-based access. This guide will take you through the process of building a Monthly Sales Report and Tracker in Google Sheets, ensuring you track and analyze your sales data with ease and precision.
Table of Contents
ToggleWhy Use Google Sheets for Sales Reports?
Google Sheets is a free, accessible, and easy-to-use tool that allows businesses of all sizes to track their sales performance. Its real-time collaboration features, seamless integration with other Google Workspace apps, and ability to manage large datasets make it an excellent choice for creating a monthly sales report.
Here are some of the key benefits of using Google Sheets:
- Real-time Collaboration: Multiple team members can access and update the sheet at the same time.
- Cloud-Based: Your data is stored in the cloud, making it accessible from anywhere, anytime.
- Customization: Google Sheets offers a variety of formulas, charts, and customization options to tailor your report to your specific needs.
Creating a Monthly Sales Report in Google Sheets
Setting Up Your Sales Report Sheet
To begin with, you’ll need to create two main tabs within your Google Sheet: Sales Report and Sales Report Tracker. Let’s take a deeper look at how each of these tabs works and what information they hold.
Sales Report Tab
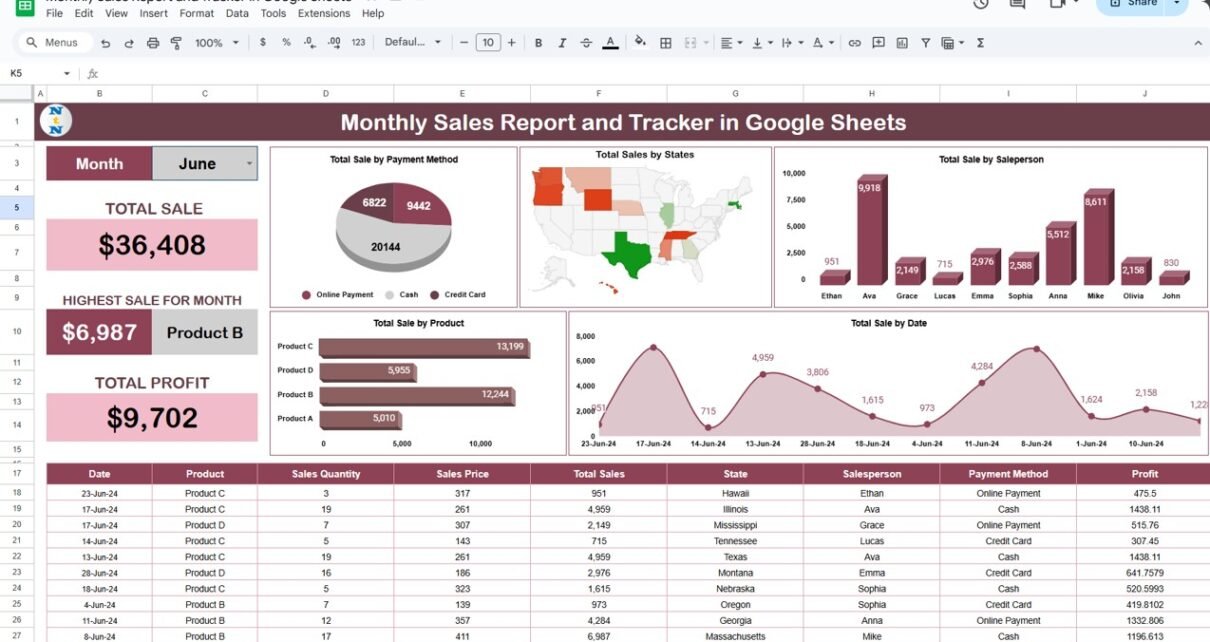
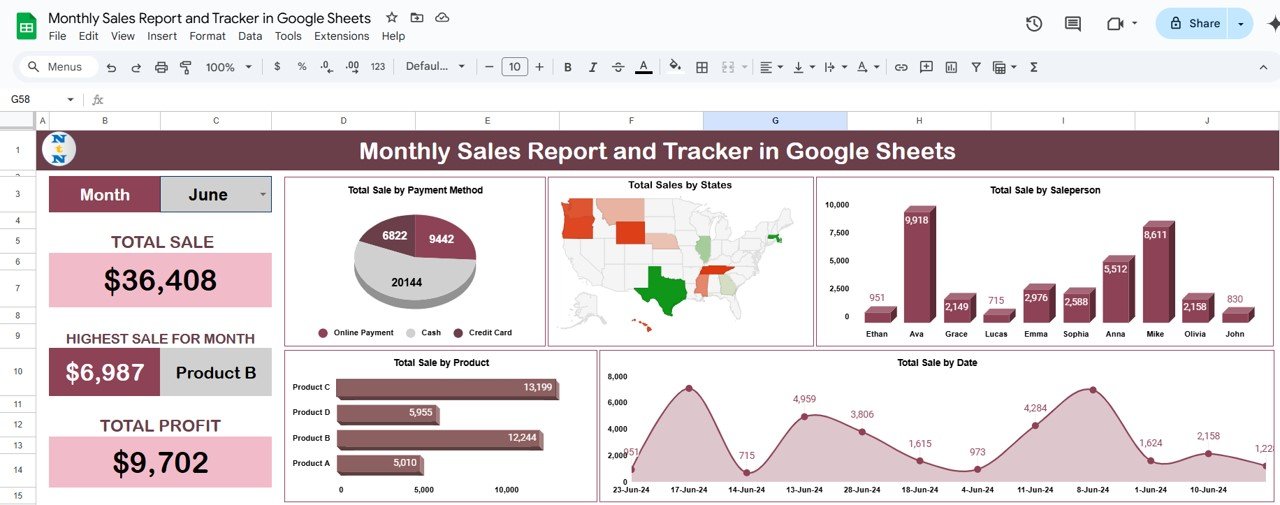
This is the dashboard-like tab where you can visualize key metrics and sales performance for a given month. It includes essential data and charts to summarize your sales and profit.
Click to buy Monthly Sales Tracker and Report in Google Sheets
Key Features of the Sales Report Tab
- Month Selection Dropdown: The month selector allows you to filter the data based on the selected month. For example, if you choose “June”, all the charts and figures will automatically update to reflect the sales for that month.
- Total Sales: This field displays the total sales figure for the selected month. It sums up all the sales recorded for the given period, offering a quick snapshot of your overall sales performance.
- Highest Sale for Month: This section shows the highest sale recorded in that month, helping you identify the top-performing product or sale. For instance, “Product B” might have contributed $6,987 to the total sales.
- Total Profit: This represents the total profit generated in that month, calculated by subtracting the costs from the sales revenue.
- Total Sales by Payment Method (Pie Chart): A pie chart visualizes the distribution of sales by different payment methods. It allows you to quickly assess which payment methods are most popular among customers.
- Total Sales by States (Map): The map chart shows the sales distribution across various states. This is a great way to identify regional sales trends.
- Total Sales by Salesperson (Column Chart): This column chart breaks down the sales performance of each salesperson, helping you track their contributions to the total sales.
- Total Sales by Product (Bar Chart): A bar chart displays sales figures for different products. This is essential for understanding which products are driving revenue.
- Total Sales by Date (Area Chart): The area chart shows how sales vary throughout the month. This chart helps you identify trends, such as busy or slow periods, and make adjustments accordingly.
Click to buy Monthly Sales Tracker and Report in Google Sheets
Sales Report Tracker Tab
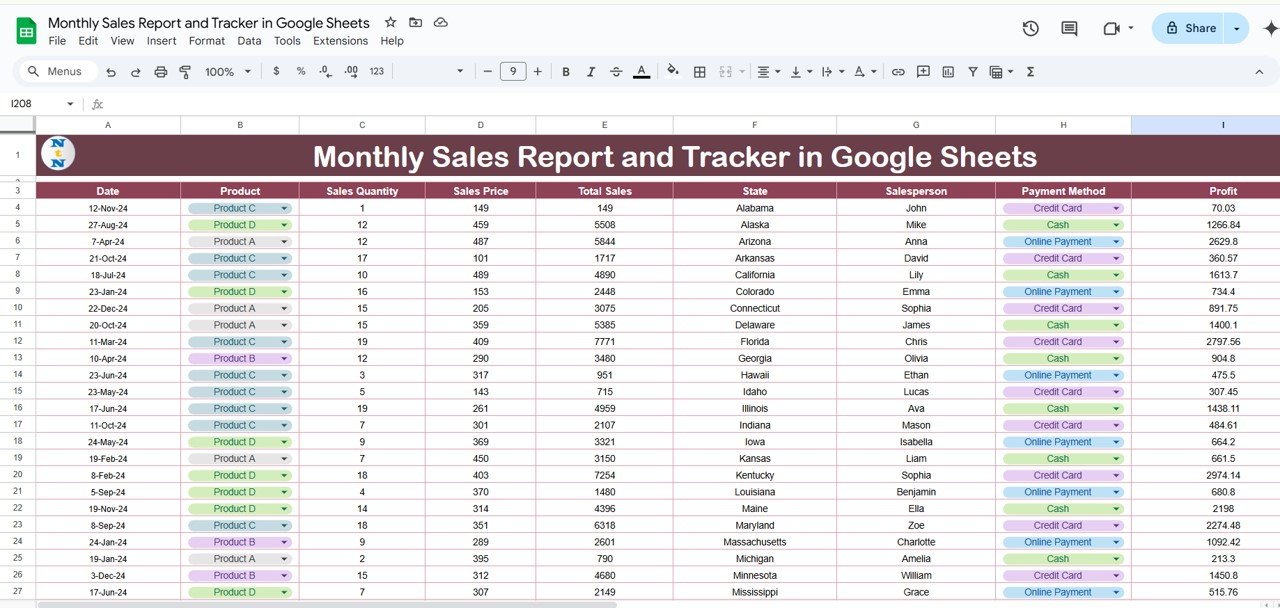
The Sales Report Tracker is where you input all your raw sales data. This tab is designed for detailed tracking and serves as the foundation for the summary in the Sales Report tab.
Key Columns in the Sales Report Tracker Tab
- Date: The date of the sale helps you organize sales by day, enabling you to track daily performance.
- Product: This column records the product sold. You can list all products offered, helping to track sales performance per product.
- Sales Quantity: The quantity column tracks how many units of the product were sold. This is crucial for inventory management and understanding demand.
- Sales Price: This field records the price at which the product was sold, which is essential for revenue calculations.
- Total Sales: This is the total sales amount, calculated by multiplying the sales quantity by the sales price. It is automatically populated when you input the quantity and price.
- State: The state column tracks where the sale occurred. This is important for understanding geographic performance and sales trends.
- Salesperson: This column records the salesperson responsible for the sale, allowing you to track individual performance.
- Payment Method: This column specifies how the customer paid for the product, such as cash, card, or online payment.
- Profit: This tracks the profit for each sale. It’s calculated by subtracting the cost of goods sold (COGS) from the total sales price.
Click to buy Monthly Sales Tracker and Report in Google Sheets
Advantages of Using a Monthly Sales Report and Tracker in Google Sheets
Creating and maintaining a monthly sales report in Google Sheets provides several key advantages:
- Centralized Data: Google Sheets consolidates all your sales data in one place, making it easier to analyze and reference.
- Customizable: You can customize charts, formulas, and layouts according to your specific sales goals and objectives.
- Accessible: Since Google Sheets is cloud-based, it can be accessed from any device with internet access. No more worrying about lost or inaccessible files.
- Collaboration: Multiple team members can work on the sales report at once, ensuring everyone has access to the latest data and reducing the risk of errors.
Opportunities for Improvement in Sales Tracking
While Google Sheets offers an excellent platform for sales reporting, there are always areas for improvement. Here are a few suggestions for enhancing your sales report:
- Automated Data Entry: To streamline data input, consider using Google Forms to collect sales data directly from sales teams or use integrations with POS systems to automatically populate the tracker.
- Advanced Analytics: You can incorporate advanced formulas, such as moving averages, growth rates, or predictive analysis, to gain deeper insights into your sales trends.
- Custom Alerts: Set up custom notifications in Google Sheets to alert you when specific sales targets are met or when a product’s sales exceed or fall below expectations.
- Integration with CRM: By linking your sales report with your CRM system, you can automatically import customer data, track leads, and manage follow-ups more efficiently.
Best Practices for Maintaining a Sales Report and Tracker in Google Sheets
To ensure your sales report and tracker are effective and reliable, follow these best practices:
- Use Clear Formatting: Keep the layout clean and easy to read. Use bold headers, color coding, and borders to make important data stand out.
- Update Regularly: Ensure that the data is updated regularly, ideally daily or weekly, to keep your sales tracking accurate.
- Validate Data: Use data validation rules in Google Sheets to prevent errors during data entry. For example, restrict sales price input to numerical values only.
- Protect Sensitive Data: If your sales data contains confidential information, consider using Google Sheets’ protection features to restrict access to certain ranges or sheets.
- Backup Your Data: Regularly back up your Google Sheets data to avoid losing important information in case of accidental deletion or corruption.
Frequently Asked Questions (FAQs)
1. How do I create a Sales Report in Google Sheets?
To create a sales report in Google Sheets, start by setting up two tabs: Sales Report and Sales Report Tracker. The Sales Report tab will include key metrics such as total sales, highest sale for the month, sales by region, and more. The Sales Report Tracker tab is where you’ll input detailed sales data like product name, quantity, price, and payment method.
2. Can I automate my sales report updates in Google Sheets?
Yes, you can automate the updating of your sales report using Google Sheets’ integrations with tools like Zapier, Google Forms, or POS systems. You can also use Google Apps Script to automate repetitive tasks, such as importing data or generating reports.
3. How do I track sales by product and salesperson?
In the Sales Report tab, you can use bar charts or column charts to visualize sales by product and salesperson. Simply input the product or salesperson information in the Sales Report Tracker tab, and the charts will automatically update to reflect this data.
4. Can I use Google Sheets to track sales by region or state?
Yes, you can use Google Sheets’ map chart feature to track sales by state or region. Input the region information in the Sales Report Tracker tab, and the map chart in the Sales Report tab will visually display your sales distribution across different locations.
5. How do I calculate profit in the sales report?
Profit is calculated by subtracting the cost of goods sold (COGS) from the total sales amount. You can add a profit column in your Sales Report Tracker to track profit for each sale. The formula in Google Sheets would look like:
Conclusion
A well-structured Monthly Sales Report and Tracker in Google Sheets can significantly improve how businesses track and analyze their sales data. With its user-friendly features, customizable options, and collaboration tools, Google Sheets is the perfect platform to manage and visualize sales performance. By following the best practices and regularly updating your data, you’ll be able to make better-informed business decisions and drive grow
Visit our YouTube channel to learn step-by-step video tutorials
Youtube.com/@NeotechNavigators
