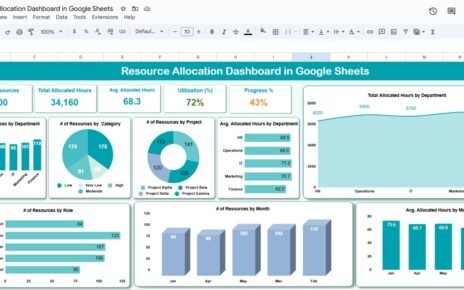
Managing office assets efficiently is crucial for minimizing costs, tracking depreciation, and ensuring operational efficiency. The Office Asset Management Dashboard in Google Sheets is a ready-to-use solution that helps facility managers, finance teams, and IT departments monitor asset performance, value, and lifecycle in a single dashboard.Office Asset Management Dashboard in Google Sheets
In this article, we’ll explore the key features, advantages, best practices, and FAQs for using this dashboard effectively.Office Asset Management Dashboard in Google Sheets
What Is an Office Asset Management Dashboard?
An Office Asset Management Dashboard is a visual tool designed to track and analyze organizational assets. It consolidates data such as asset count, value, depreciation, warranty, and status, providing insights that help managers make informed decisions.
With Google Sheets, this dashboard allows:
-
Real-time monitoring of assets
-
Tracking depreciation and net book value
-
Monitoring warranty and asset status
-
Analyzing asset allocation by department, vendor, or type
Key Features of the Dashboard
The dashboard includes multiple sheet tabs for comprehensive asset management:
1. Overview Sheet Tab
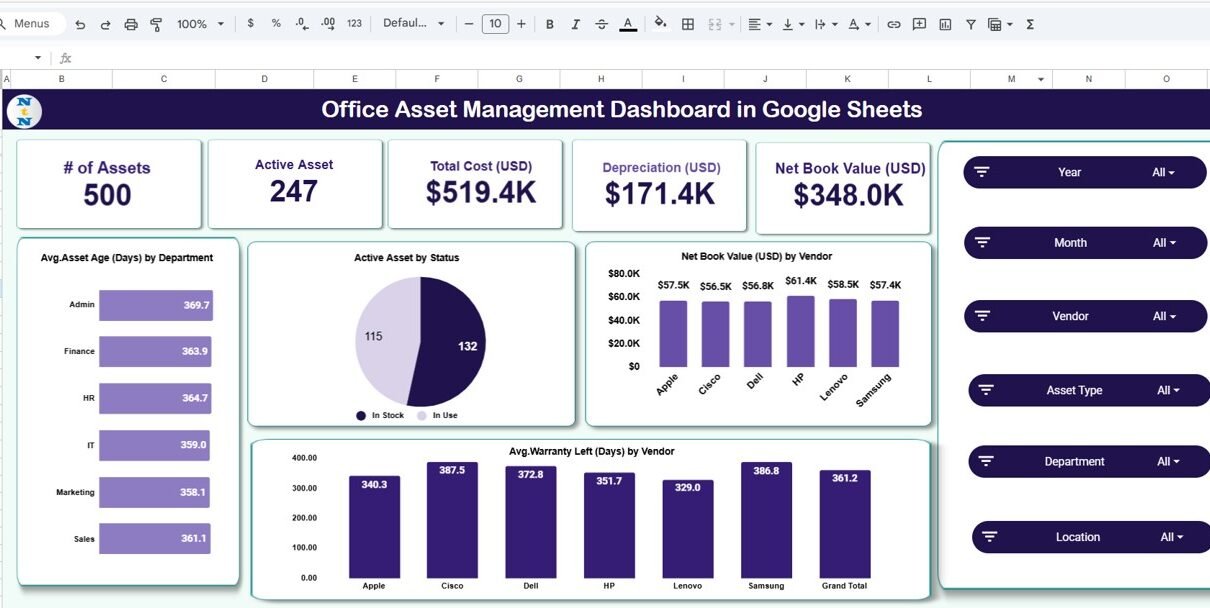
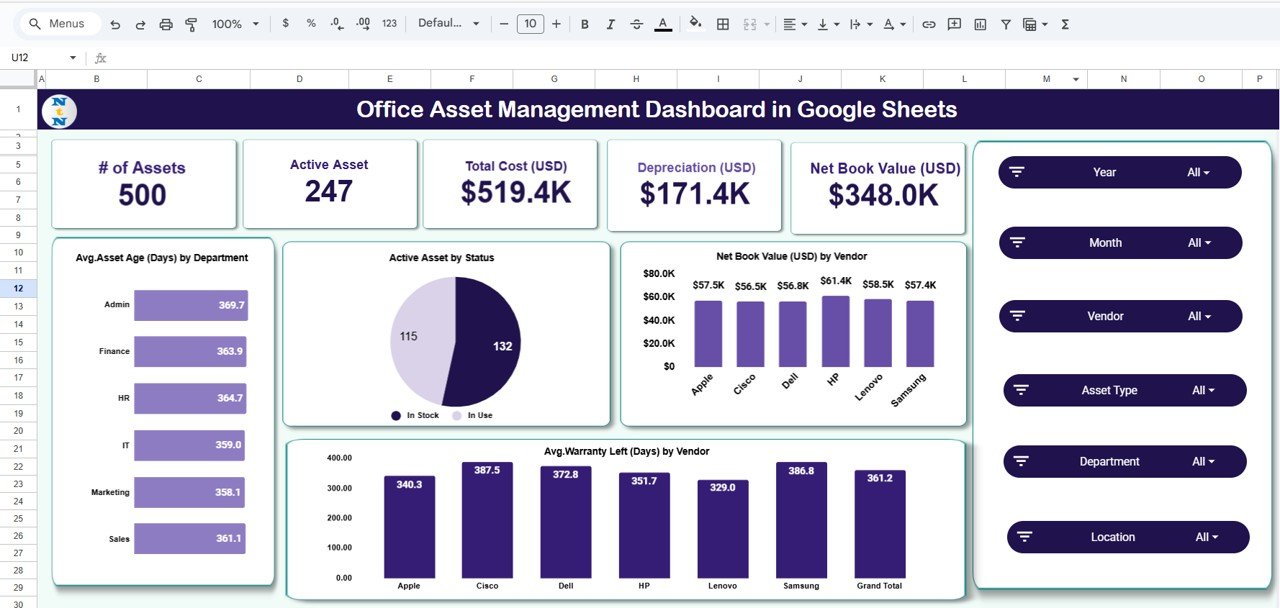
The Overview sheet provides a snapshot of all assets using cards and charts.
Cards:
-
# of Assets: Total number of assets tracked
-
Active Assets: Currently active assets in use
-
Total Cost (USD): Original purchase cost of all assets
-
Depreciation (USD): Total depreciation for all assets
-
Net Book Value (USD): Current value after depreciation
Charts:
-
Avg. Asset Age (Days) by Department: Tracks how long assets have been in use
-
Active Assets by Status: Shows operational, under maintenance, or retired assets
-
Net Book Value by Vendor: Highlights vendor contributions to asset value
-
Avg. Warranty Left (Days) by Vendor: Tracks remaining warranty period for assets
Click to Buy Office Asset Management Dashboard in Google Sheets
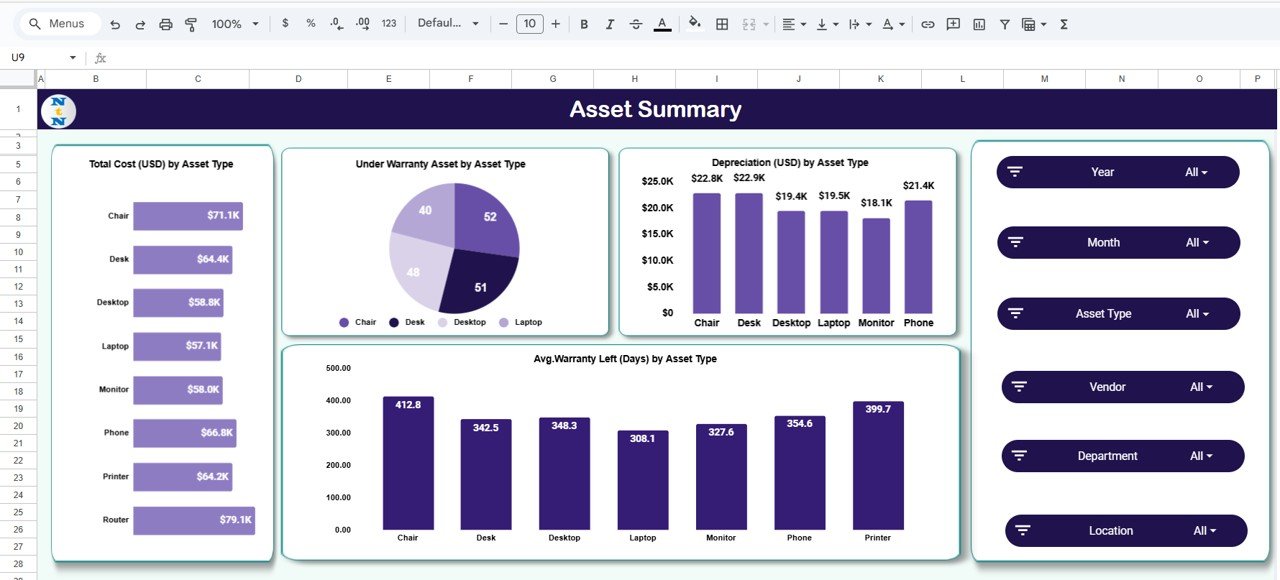
2. Asset Summary Sheet
Provides analysis by asset type:
Charts:
-
Total Cost (USD) by Asset Type: Visualizes cost distribution
-
Under Warranty Asset by Asset Type: Shows assets currently under warranty
-
Depreciation (USD) by Asset Type: Tracks depreciation for different asset categories
-
Avg. Warranty Left (Days) by Asset Type: Helps plan maintenance or replacements
Click to Buy Office Asset Management Dashboard in Google Sheets
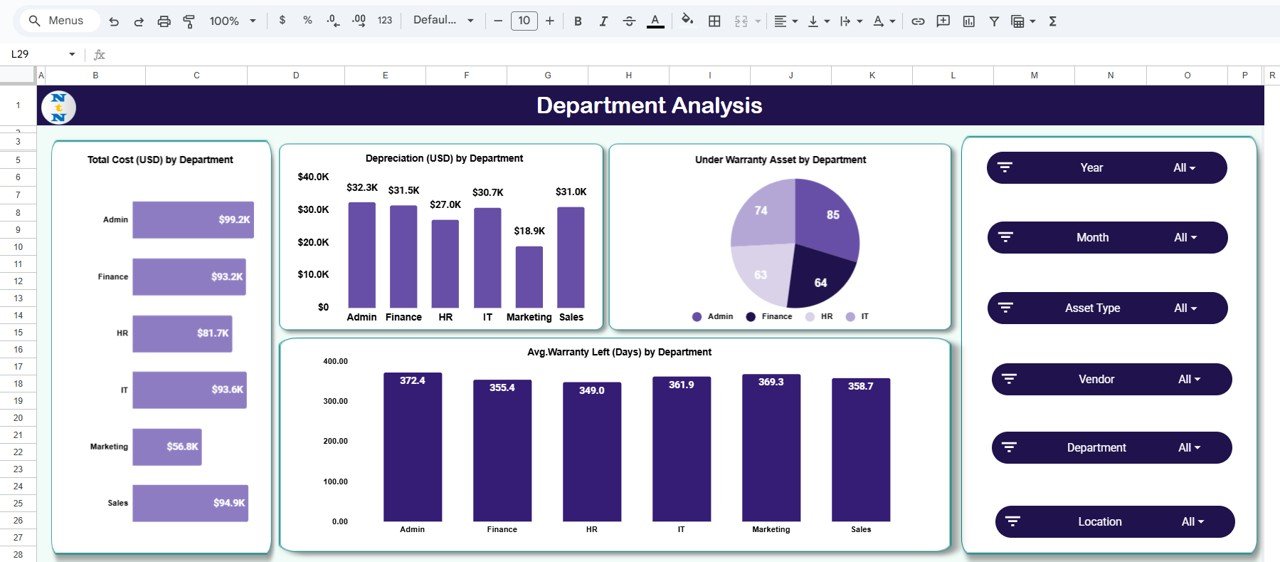
3. Department Analysis Sheet
Analyzes assets at the departmental level:
Charts:
-
Total Cost (USD) by Department
-
Depreciation (USD) by Department
-
Under Warranty Asset by Department
-
Avg. Warranty Left (Days) by Department
This view helps department managers monitor asset usage and plan budgets.
Click to Buy Office Asset Management Dashboard in Google Sheets
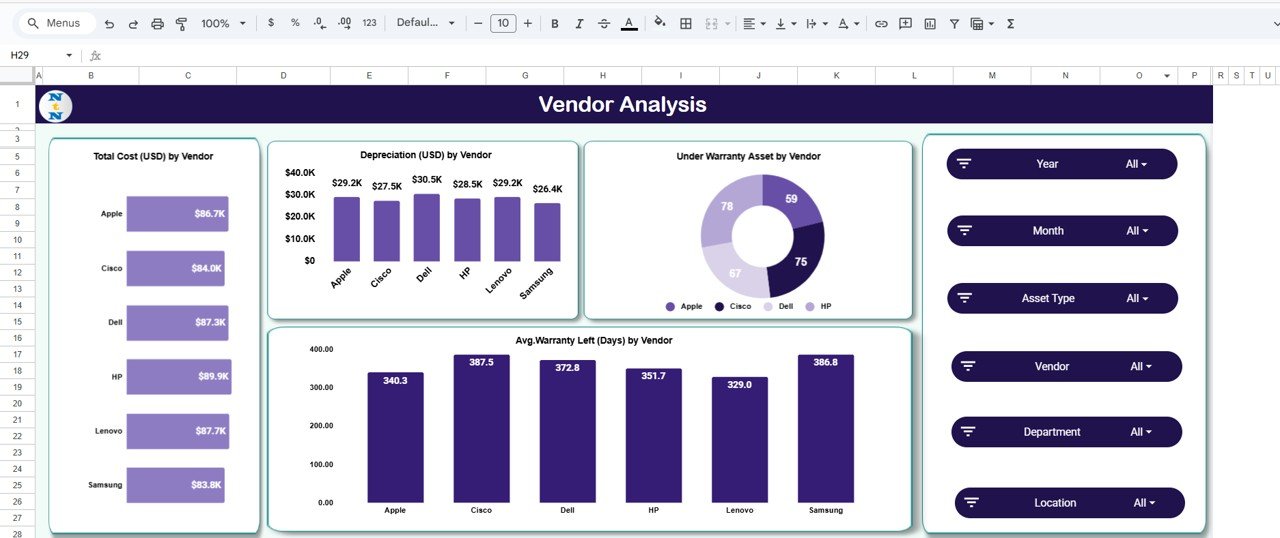
4. Vendor Analysis Sheet
Provides insights by vendor:
Charts:
-
Total Cost (USD) by Vendor
-
Depreciation (USD) by Vendor
-
Under Warranty Asset by Vendor
-
Avg. Warranty Left (Days) by Vendor
Vendor analysis helps evaluate procurement efficiency and vendor reliability.
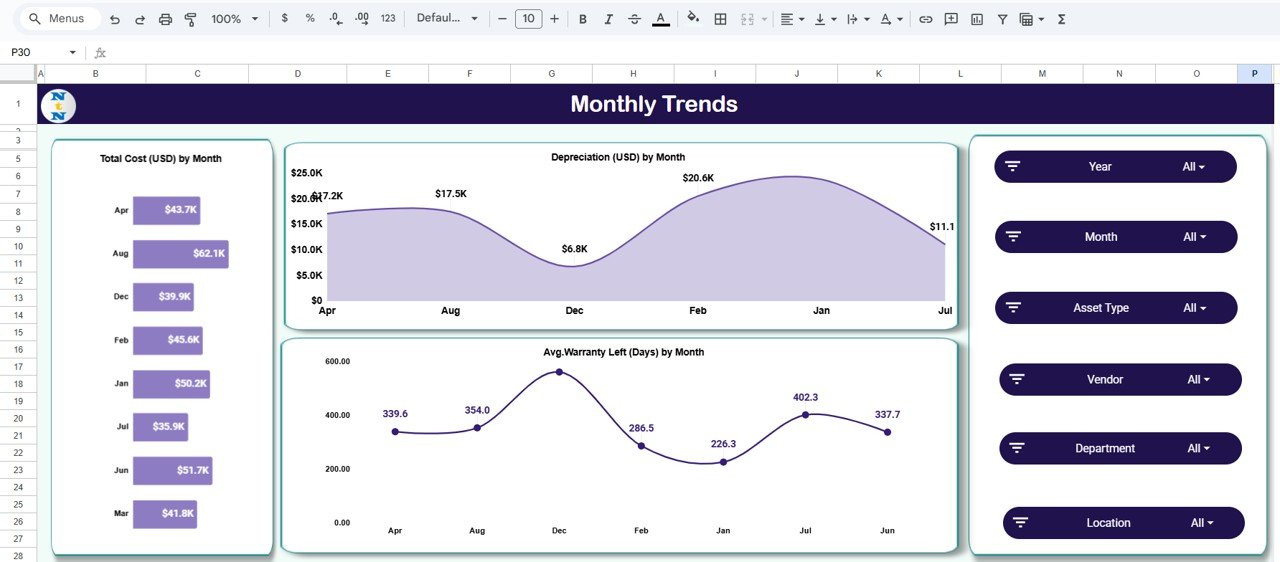
5. Monthly Trends Sheet
Tracks asset financial trends over time:
Charts:
-
Total Cost (USD) by Month
-
Depreciation (USD) by Month
-
Avg. Warranty Left (Days) by Month
This sheet helps forecast future asset replacement and budget needs.
Click to Buy Office Asset Management Dashboard in Google Sheets
6. Search Sheet Tab
-
Allows quick search by keyword and field name
-
Easily filter assets by name, department, vendor, or type

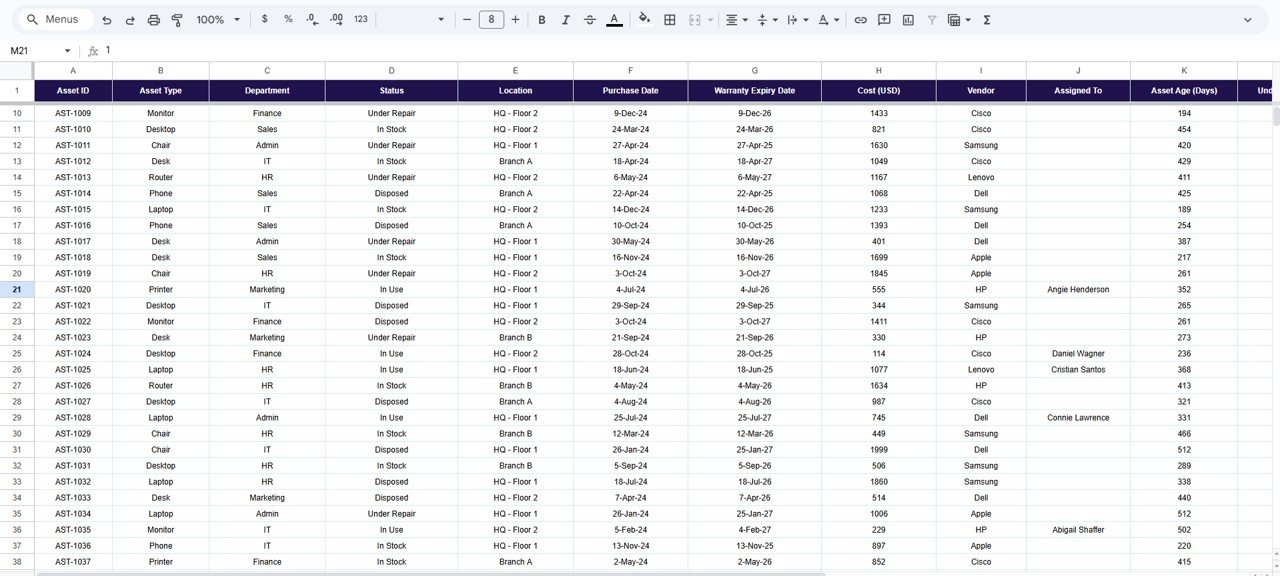
7. Data Sheet Tab
The Data sheet serves as the input database:
-
Contains all asset details including purchase date, cost, vendor, department, status, and warranty
-
Updates automatically reflect across the dashboard for real-time insights
Click to Buy Office Asset Management Dashboard in Google Sheets
Advantages of Using the Office Asset Management Dashboard
-
Centralized Asset Tracking: All asset information in one place
-
Visual Insights: Cards and charts provide instant understanding of asset performance
-
Monitor Depreciation: Track asset value over time and calculate net book value
-
Warranty Management: Avoid expired warranties and plan replacements
-
Department & Vendor Insights: Understand allocation and vendor performance
-
Trend Analysis: Forecast future expenses and optimize asset lifecycle
Best Practices for Using the Dashboard
-
Update Asset Data Regularly: Maintain accurate records of purchase, depreciation, and status
-
Segment Analysis: Track assets by department, vendor, and type for detailed insights
-
Monitor Warranty Expiry: Plan timely maintenance and replacements
-
Use Conditional Formatting: Highlight assets approaching end-of-life or warranty expiry
-
Review Monthly Trends: Evaluate depreciation trends and financial impact
-
Collaborate: Share the Google Sheet with relevant teams for real-time updates
Frequently Asked Questions (FAQs)
Click to Buy Office Asset Management Dashboard in Google Sheets
Q1: Can I add new assets to this dashboard?
Yes, simply enter new asset details in the Data sheet, and charts and cards will update automatically.
Q2: Can I track assets by location?
Yes, you can add a Location column in the Data sheet and use it for departmental or vendor analysis.
Q3: Can multiple users update the dashboard simultaneously?
Yes, Google Sheets allows real-time collaboration, making it easy for multiple users to manage assets.
Q4: Does this dashboard track depreciation automatically?
You can set formulas in the Data sheet to calculate depreciation and net book value, which will reflect in the dashboard.
Q5: Can this dashboard help with budgeting for asset replacement?
Yes, by tracking depreciation and warranty periods, you can forecast future replacements and budget accordingly.
Conclusion
The Office Asset Management Dashboard in Google Sheets is a powerful tool for tracking, analyzing, and managing organizational assets. With detailed cards, charts, departmental insights, and trend analysis, it allows managers to optimize asset usage, plan budgets, and ensure timely maintenance or replacement.
Visit our YouTube channel to learn step-by-step video tutorials
Youtube.com/@NeotechNavigators
Watch the step-by-step video Demo:
Click to Buy Office Asset Management Dashboard in Google Sheets