Organizations today face increasing pressure to reduce operational costs, optimize workspace utilization, and meet sustainability goals. However, sustainability data often remains scattered across spreadsheets, utility bills, and manual reports. As a result, tracking energy usage, water consumption, occupancy, and environmental impact becomes time-consuming and ineffective.
That is exactly why the Office Sustainability Dashboard in Google Sheets is a powerful and practical solution. This ready-to-use dashboard transforms raw sustainability and facility data into clear KPIs, visual insights, and actionable trends—all within Google Sheets.
In this article, we explain what the Office Sustainability Dashboard in Google Sheets is, how it works, its page-wise structure, key benefits, best practices, and real-world use cases.
What Is an Office Sustainability Dashboard in Google Sheets?
An Office Sustainability Dashboard in Google Sheets is a centralized reporting and analytics tool designed to monitor workplace sustainability metrics such as:
-
Energy consumption (kWh)
-
Energy cost (USD)
-
Seat utilization and occupancy
-
Water consumption and cost
-
Waste generation
-
Renewable energy usage
-
Workspace efficiency
Instead of reviewing multiple data sources, facility managers and sustainability teams can analyze all sustainability KPIs from one interactive dashboard. Because the dashboard is built in Google Sheets, it remains cloud-based, collaborative, and easy to maintain.
Why Use Google Sheets for Sustainability Reporting?
Click to Buy Office Sustainability Dashboard in Google Sheets
Google Sheets offers several advantages for sustainability dashboards:
- Cloud access from anywhere
- Real-time collaboration across teams
- Easy integration with manual or automated data
- No additional software or licensing costs
- Simple filtering, sorting, and chart updates
As a result, this dashboard is ideal for offices, shared workspaces, corporate campuses, and multi-location organizations.
Key Features of Office Sustainability Dashboard in Google Sheets
🔹 Ready-to-Use Design
The dashboard comes fully structured with KPIs, charts, and analysis pages—no setup required.
🔹 Interactive Filters
Use slicers to filter data by:
- Region
- Country
- City
- Department
- Workspace type
- Building type
- Date or weekday
🔹 KPI-Driven Layout
All key sustainability metrics are displayed using cards, bar charts, line charts, and trend visuals.
🔹 Automated Analysis
Once data is entered in the data sheet, all charts and KPIs update automatically.
Dashboard Pages and Analysis Structure
Click to Buy Office Sustainability Dashboard in Google Sheets
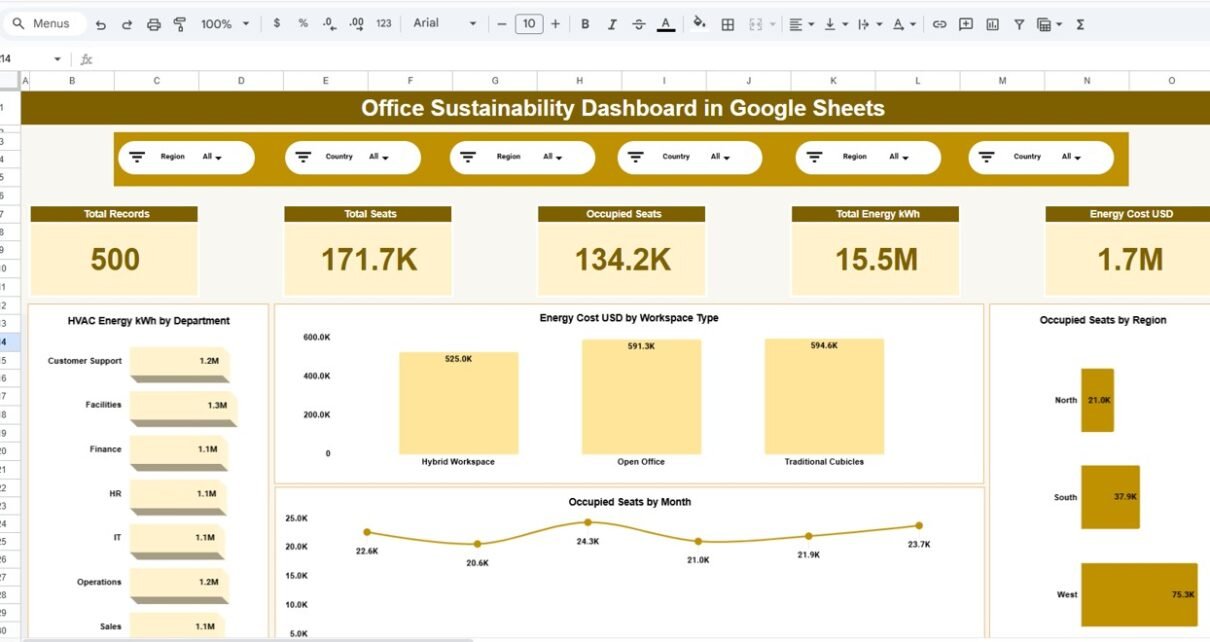
1️⃣ Overview Page
The Overview page provides a high-level snapshot of office sustainability performance.
KPI Cards
-
Total Records
-
Total Seats
-
Occupied Seats
-
Total Energy Consumption (kWh)
-
Total Energy Cost (USD)
Charts
-
HVAC Energy Consumption by Department
-
Energy Cost by Workspace Type
-
Occupied Seats by Region
-
Occupied Seats Trend by Month
This page helps leadership quickly understand overall sustainability performance.

Click to Buy Office Sustainability Dashboard in Google Sheets
2️⃣ Department Analysis
The Department Analysis page focuses on sustainability metrics across departments.
Charts
-
Total Seats by Department
-
Occupied Seats by Department
-
Energy Cost (USD) by Department
-
Water Cost (USD) by Department
This analysis highlights departments with high energy or water usage and identifies optimization opportunities.

Click to Buy Office Sustainability Dashboard in Google Sheets
3️⃣ Energy Analysis
The Energy Analysis page dives deeper into electricity consumption patterns.
Charts
-
Total Energy (kWh) by Building Type
-
Grid Energy (kWh) by Weekday
-
IT Energy (kWh) by Department
-
Renewable Energy (kWh) by Region
This page supports energy efficiency planning and renewable energy adoption strategies.

4️⃣ Water Management Analysis
The Water Management Analysis page tracks water usage and waste.
Charts
-
Average Water Intensity (m³ per seat) by Weekday
-
Water Cost (USD) by Region
-
Water Consumption (m³) by Department
-
Total Waste (kg) by City
This analysis helps organizations monitor environmental impact and reduce water and waste costs.

Click to Buy Office Sustainability Dashboard in Google Sheets
Search & Detailed Data View
The Search page enables fast data exploration.
Features
-
Search by keyword
-
Search by selected column (Department, City, Region, etc.)
-
Filter large datasets instantly
-
View underlying transactional sustainability records
This makes audits, reviews, and compliance reporting much easier.

Click to Buy Office Sustainability Dashboard in Google Sheets
Who Can Use This Dashboard?
This dashboard is ideal for:
-
Facility Managers
-
Sustainability Teams
-
ESG & Compliance Officers
-
Operations Managers
-
Corporate Real Estate Teams
-
Green Building Consultants
-
Shared Workspace Operators
Advantages of Office Sustainability Dashboard in Google Sheets
-
Centralized Sustainability Monitoring
-
Clear visualization of energy, water, and occupancy data
-
Improved energy efficiency decisions
-
Reduced operational and utility costs
-
Better workspace utilization
-
Quick identification of inefficiencies
-
Cloud-based and collaborative
-
No coding or BI tools required
Opportunities for Improvement
Click to Buy Office Sustainability Dashboard in Google Sheets
-
Integrate automated data sources (smart meters, IoT)
-
Add carbon emission conversion metrics
-
Include ESG compliance benchmarks
-
Connect with Google Forms for live data capture
-
Add predictive trend analysis using historical data
Best Practices for Using the Dashboard
-
Update data regularly (daily, weekly, or monthly)
-
Standardize department and region names
-
Use slicers for focused analysis
-
Review trends instead of single-month values
-
Compare occupancy with energy usage
-
Monitor high-cost departments closely
-
Share dashboard access with stakeholders
How This Dashboard Improves Sustainability Strategy
Click to Buy Office Sustainability Dashboard in Google Sheets
By combining operational, environmental, and occupancy data in one place, this dashboard helps organizations:
-
Reduce energy and water waste
-
Improve office space planning
-
Support ESG and sustainability reporting
-
Track progress toward green building goals
-
Make data-driven sustainability investments
Final Thoughts
The Office Sustainability Dashboard in Google Sheets is a practical, scalable, and cost-effective solution for organizations aiming to manage sustainability smarter. Instead of relying on static reports and disconnected spreadsheets, this dashboard delivers real-time insights that drive measurable environmental and financial improvements.
If your goal is to improve workplace sustainability while maintaining full visibility and control, this ready-to-use Google Sheets dashboard is the perfect starting point.
Visit our YouTube channel to learn step-by-step video tutorials
Youtube.com/@NeotechNavigators
Watch the step-by-step video tutorial:
Click to Buy Office Sustainability Dashboard in Google Sheets