Managing travel and expense data efficiently is vital for every organization. From flight bookings to accommodation costs, approvals, and reimbursements — tracking all of these manually can quickly become overwhelming. That’s where the Office Travel and Expense Dashboard in Google Sheets comes in.Office Travel and Expense Dashboard in Google Sheets
This ready-to-use dashboard provides complete visibility into business travel trends, departmental spending, and approval timelines. Built entirely in Google Sheets, it’s easy to use, collaborative, and highly customizable.Office Travel and Expense Dashboard in Google Sheets
What Is an Office Travel and Expense Dashboard in Google Sheets?
An Office Travel and Expense Dashboard in Google Sheets is a data-driven tool designed to track business trips, related expenses, approval times, and department-wise costs — all in one place.
It provides an analytical overview of corporate travel patterns through cards, charts, and visual summaries. Managers can instantly view total trips, expenses by city, and average trip duration, helping them control budgets and streamline approvals.
This solution eliminates the need for expensive travel management systems, offering a simple, cloud-based alternative.
Overview Sheet Tab
Click to Buy Office Travel and Expense Dashboard in Google Sheets
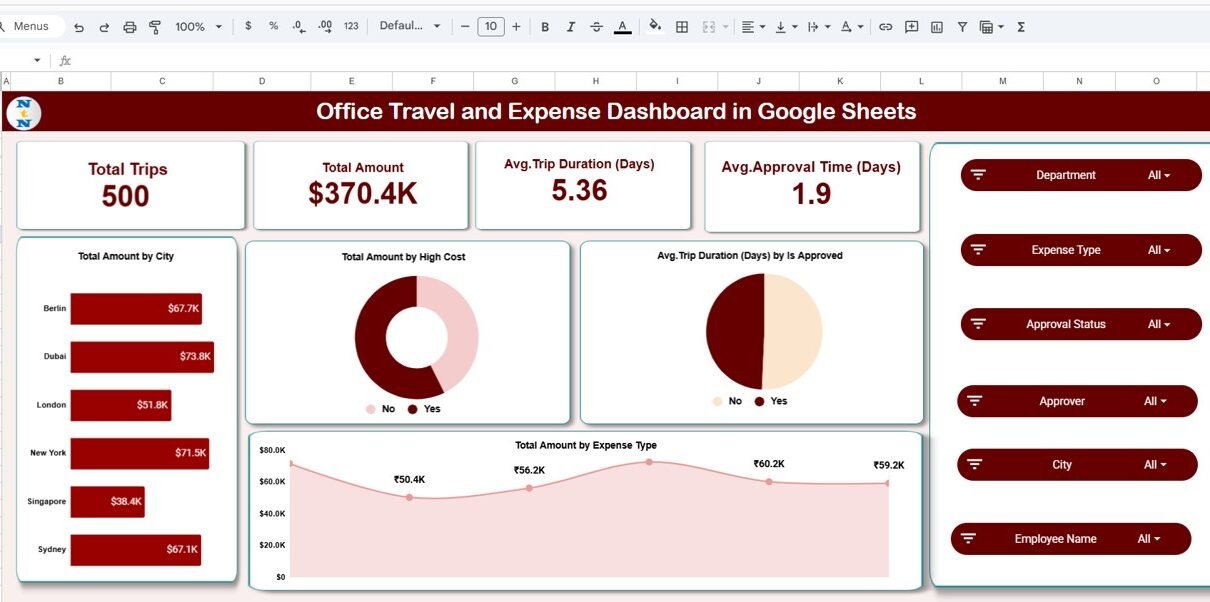
The Overview sheet tab is the primary dashboard that summarizes all key travel and expense metrics.
KPI Cards
At the top, you’ll find four essential performance indicators:
-
Total Trips – Number of trips taken during the selected period.
-
Total Amount – Total cost incurred for all trips.
-
Avg. Trip Duration (Days) – Average number of days per trip.
-
Avg. Approval Time (Days) – Average time taken for travel approval.
These KPIs help management assess the scale, cost, and efficiency of travel operations.
Key Charts
The dashboard includes multiple charts for a complete analytical view:
-
Total Amount by City – Reveals how much each city contributes to overall spending.
-
Total Amount by High Cost – Highlights the costliest trips or destinations.
-
Avg. Trip Duration (Days) by Is Approved – Compares approved vs. unapproved trip durations.
-
Total Amount by Expense Type – Breaks down costs by type such as airfare, lodging, meals, or transport.
Together, these visuals provide an instant financial snapshot and help identify cost-saving opportunities.

Click to Buy Office Travel and Expense Dashboard in Google Sheets
Department Summary
The Department Summary section enables management to monitor which departments are generating the most travel activity and expenses.
Charts in This Section
-
Total Trips by Department – Compares the total number of trips across departments (HR, Sales, IT, etc.).
-
Avg. Trip Duration (Days) by Department – Evaluates how long employees from each department are on business trips.
-
Avg. Approval Time (Days) by Department – Measures how fast departments approve travel requests.
This section helps organizations improve travel policies and reduce approval delays.

Click to Buy Office Travel and Expense Dashboard in Google Sheets
City Analysis
The City Analysis sheet provides location-based insights into travel behavior and cost distribution.
Charts in This Section
-
Total Trips by City – Identifies top travel destinations.
-
Avg. Trip Duration (Days) by City – Highlights average trip length per location.
-
Avg. Approval Time (Days) by City – Shows which destinations face the longest approval times.
These visuals are ideal for identifying high-frequency or high-cost destinations, allowing companies to negotiate better travel deals with vendors.

Click to Buy Office Travel and Expense Dashboard in Google Sheets
Expense Type Analysis
The Expense Type Analysis tab breaks down expenses by category, making it easier to identify areas with potential overspending.
Charts in This Section
-
Total Trips by Expense Type – Displays how many trips include each expense category.
-
Avg. Trip Duration (Days) by Expense Type – Correlates trip length with expense patterns.
-
Avg. Approval Time (Days) by Expense Type – Evaluates how approval times vary by type of expense.
This analysis helps optimize cost management and detect trends in expense claims.

Click to Buy Office Travel and Expense Dashboard in Google Sheets
Monthly Trends
The Monthly Trends section visualizes travel performance over time.
Charts in This Section
-
Total Trips by Month – Tracks overall travel activity month by month.
-
Avg. Trip Duration (Days) by Month – Monitors how long trips typically last each month.
-
Avg. Approval Time (Days) by Month – Analyzes the time it takes for approval throughout the year.
Monthly trend charts are perfect for understanding seasonal travel spikes and budgeting future trips accordingly.

Search Sheet Tab
The Search Sheet is a powerful built-in lookup feature.
-
It allows users to search by keyword or field name — for example, “New York” or “Hotel.”
-
Instantly find related trip records without scrolling through long datasets.
-
Great for quick verification, audit, or reporting.

Click to Buy Office Travel and Expense Dashboard in Google Sheets
Data Sheet Tab
The Data Sheet serves as the foundation of the entire dashboard. It stores all travel and expense entries, including:
- Trip ID
- Employee Name
- Department
- City
- Expense Type
- Amount (USD)
- Trip Start and End Dates
- Trip Duration
- Approval Status
- Approval Time (Days)

Click to Buy Office Travel and Expense Dashboard in Google Sheets
Advantages of Office Travel and Expense Dashboard in Google Sheets
-
Centralized Tracking: Combines trip details, costs, and approvals in one system.
-
Visual Insights: Instantly view performance through charts and KPIs.
-
Collaboration: Multiple team members can update or review data simultaneously.
-
Transparency: Clear visibility into departmental and city-wise spending.
-
Budget Control: Identify high-cost areas and manage travel budgets effectively.
-
Customizable: Add new columns or charts to tailor the dashboard to your organization.
-
Cloud-Based: Accessible anytime, anywhere, on desktop or mobile.
Opportunities for Improvement in This Dashboard
Click to Buy Office Travel and Expense Dashboard in Google Sheets
-
Automated Approvals: Use Google Apps Script to auto-notify managers for pending travel requests.
-
Actual vs. Estimated Cost Comparison: Add fields to analyze budget accuracy.
-
Reimbursement Tracking: Include columns for reimbursement date and method.
-
Currency Conversion: Useful for multinational teams managing global trips.
-
Integration with Google Forms: Allow employees to submit trip details online directly to the sheet.
-
Mobile Reporting Dashboard: Connect with Google Looker Studio for visual storytelling.
Best Practices for Using This Dashboard
-
Update Regularly: Add trip details immediately after approval or completion.
-
Use Consistent Data Formats: Ensure uniform date and amount entries.
-
Review Department-Wise Reports: Spot which teams need cost optimization.
-
Monitor Monthly Trends: Plan ahead for high-travel months.
-
Automate Approvals: Reduce manual work and improve response times.
-
Use Conditional Formatting: Highlight expensive trips or delayed approvals automatically.
-
Keep Data Secure: Share edit rights only with authorized users.
Conclusion
Click to Buy Office Travel and Expense Dashboard in Google Sheets
The Office Travel and Expense Dashboard in Google Sheets offers a simple yet effective way to manage and monitor all travel and expense activities. Its powerful charts, KPIs, and dynamic search capability enable organizations to make informed decisions, reduce costs, and streamline approvals.Office Travel and Expense Dashboard in Google Sheets
By combining data-driven insights with real-time collaboration, this dashboard ensures accountability, efficiency, and financial transparency across departments.Office Travel and Expense Dashboard in Google Sheets
If your goal is to modernize your travel management process — this Google Sheets dashboard is the perfect place to start.Office Travel and Expense Dashboard in Google Sheets
Frequently Asked Questions (FAQ)
1. Can this dashboard track both domestic and international trips?
Yes. You can add a “Trip Type” column to differentiate domestic and international travel.
2. Is it possible to add reimbursement tracking?
Yes. Add a “Reimbursed Amount” and “Reimbursement Date” column to monitor repayments.
3. Can multiple users access and edit the dashboard simultaneously?
Yes. Google Sheets allows real-time collaboration across users.
4. How can I analyze the highest cost destinations?
Use the chart Total Amount by City to identify cities with the highest expenses.
5. Can this dashboard integrate with Google Forms?
Yes. You can connect a form to the data sheet for easy trip submission.Office Travel and Expense Dashboard in Google Sheets
Visit our YouTube channel to learn step-by-step video tutorials
Youtube.com/@NeotechNavigators
Watch the step-by-step video Demo:
Click to Buy Office Travel and Expense Dashboard in Google Sheets