Managing daily office operations efficiently is essential to maintaining productivity and meeting deadlines. The Office Workflow Efficiency Dashboard in Google Sheets provides a ready-to-use, data-driven tool to track task completion, workload distribution, and departmental performance.Office Workflow Efficiency Dashboard in Google Sheets
In this article, we will explain the structure, features, advantages, and best practices for using this powerful dashboard template.Office Workflow Efficiency Dashboard in Google Sheets
What Is an Office Workflow Efficiency Dashboard?
An Office Workflow Efficiency Dashboard is a data visualization tool designed to help organizations monitor workflow performance, identify bottlenecks, and improve task management.
Using Google Sheets, this dashboard allows teams to:
-
Measure completed vs. overdue tasks
-
Analyze performance by department, priority, and task type
-
Track monthly progress trends
-
Evaluate workload and efficiency across employees
It’s simple to set up, easy to update, and perfect for HR, operations, or project management teams.
Key Features of the Office Workflow Efficiency Dashboard
Click to Buy Office Workflow Efficiency Dashboard in Google Sheets
This dashboard consists of multiple pages and charts, each focusing on a specific area of performance:
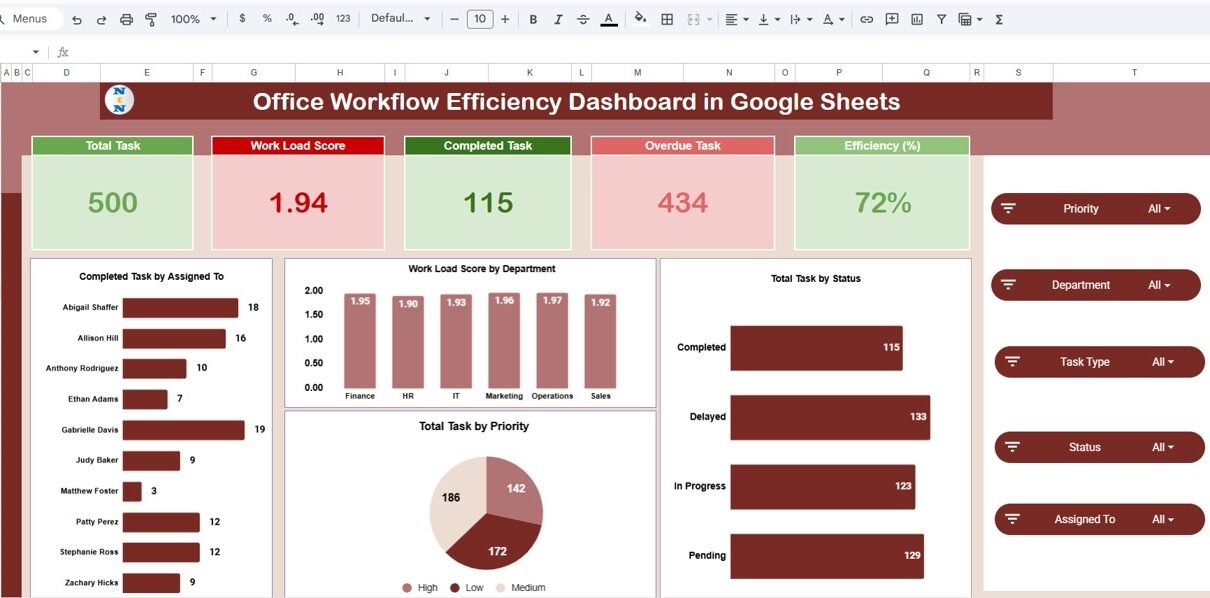
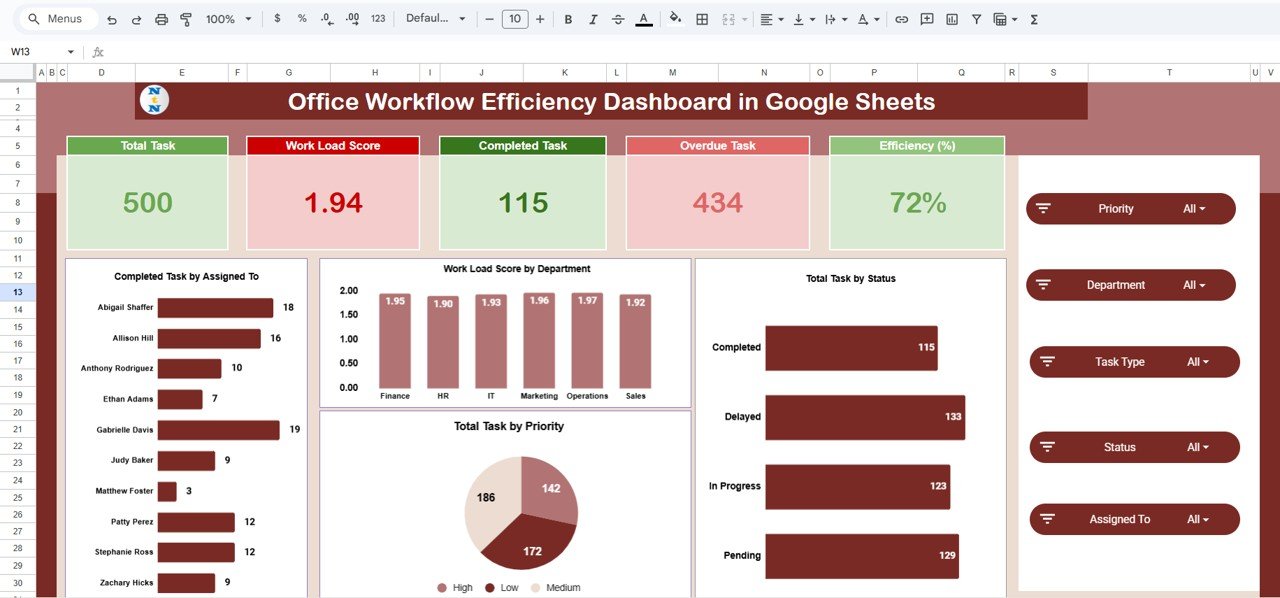
1. Overview
The Overview section provides an at-a-glance summary of key workflow metrics through cards and charts.
Cards Display:
-
Total Tasks: Total number of assigned tasks
-
Workload Score: Aggregate score representing workload pressure
-
Completed Tasks: Count of successfully completed tasks
-
Overdue Tasks: Total tasks past their deadline
-
Efficiency (%): Percentage of tasks completed on time
Charts Include:
-
Completed Tasks by Assigned To: Visualizes team member performance
-
Workload Score by Department: Highlights how workload is distributed
-
Total Tasks by Status: Shows task completion progress
-
Total Tasks by Priority: Compares workload by urgency levels
Click to Buy Office Workflow Efficiency Dashboard in Google Sheets
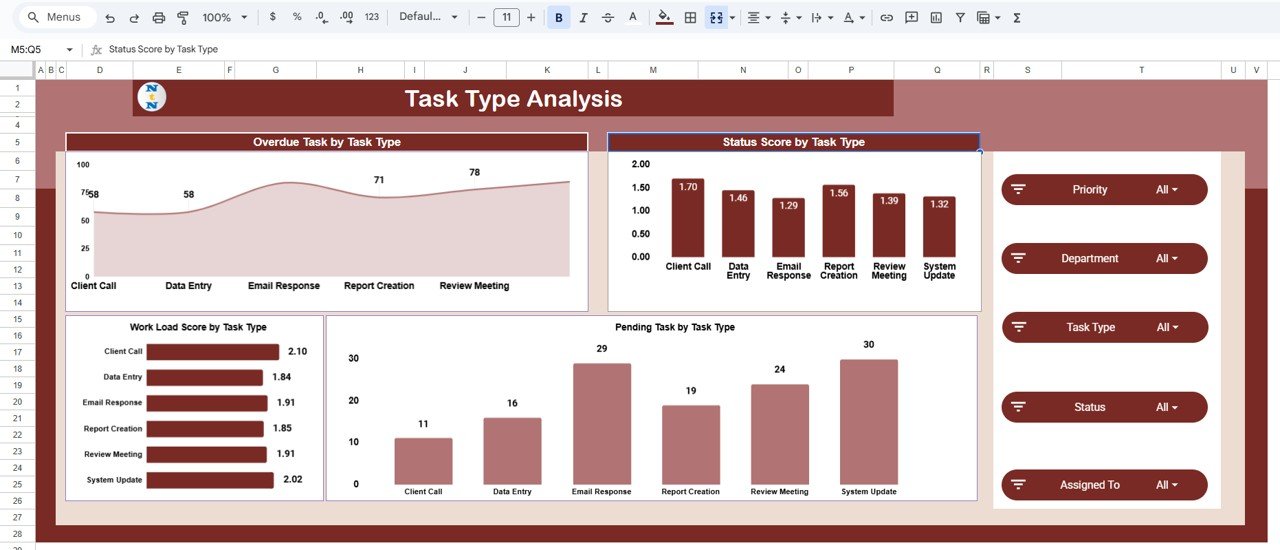
2. Task Type Analysis
This section focuses on understanding performance and efficiency across task types.
Charts Include:
-
Overdue Tasks by Task Type – Identifies categories causing delays
-
Status Score by Task Type – Compares overall progress and success rates
-
Pending Tasks by Task Type – Displays incomplete work volume
-
Workload Score by Task Type – Evaluates pressure points for each type
Click to Buy Office Workflow Efficiency Dashboard in Google Sheets
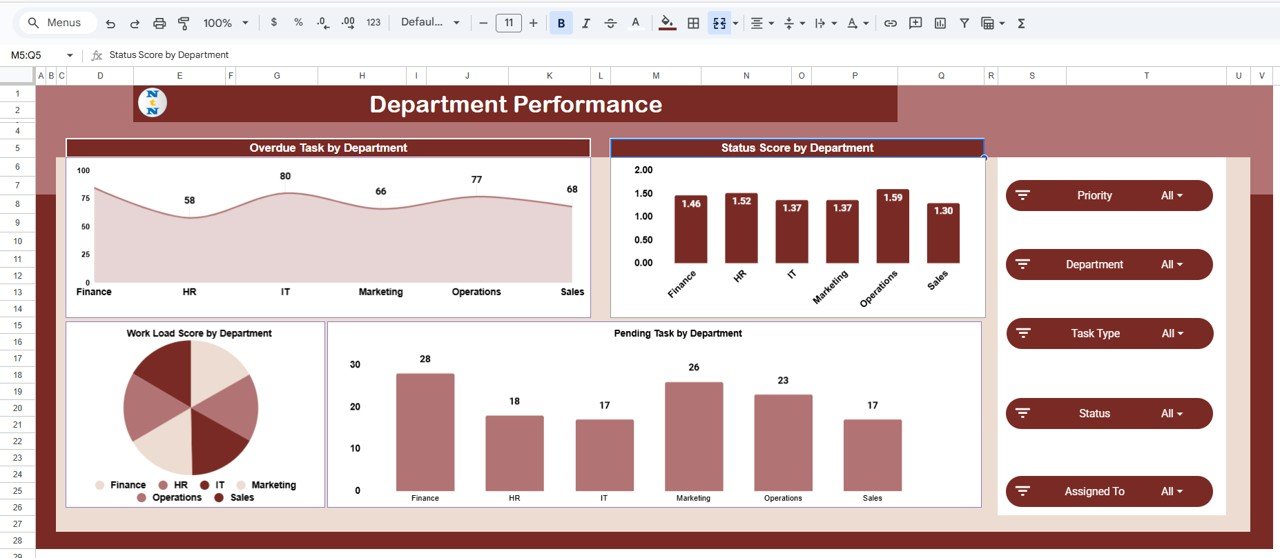
3. Department Performance
The Department Performance view analyzes how each department contributes to overall workflow efficiency.
Charts Include:
-
Overdue Tasks by Department – Detects departments with backlogs
-
Status Score by Department – Measures performance across teams
-
Pending Tasks by Department – Shows departments with ongoing workloads
-
Workload Score by Department – Monitors departmental capacity and utilization
This view helps management balance responsibilities and address underperforming teams.
Click to Buy Office Workflow Efficiency Dashboard in Google Sheets
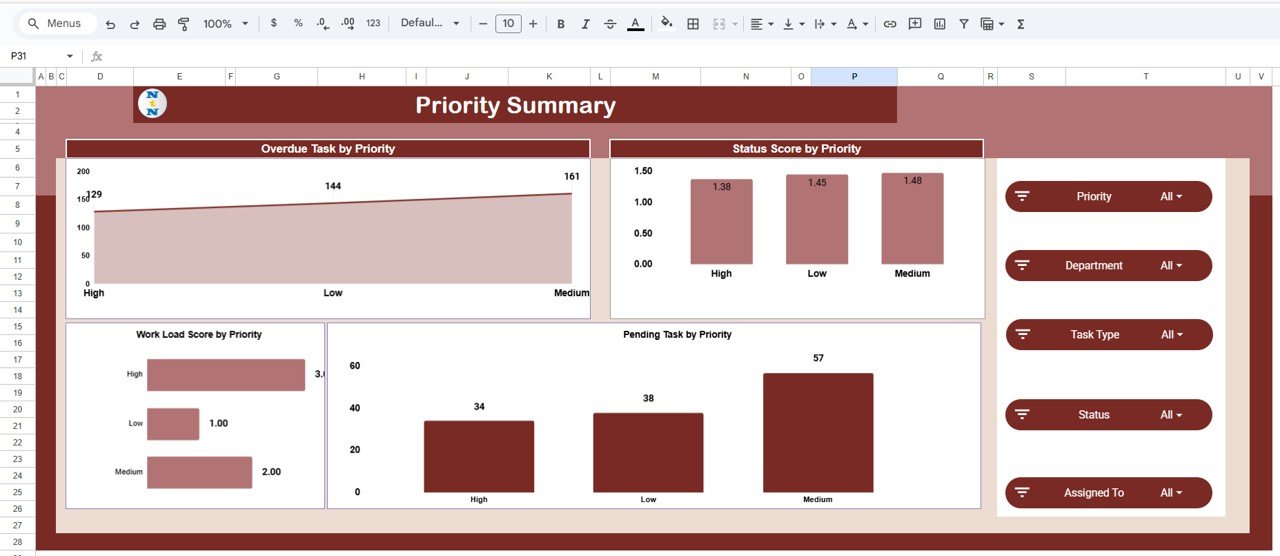
4. Priority Summary
The Priority Summary breaks down efficiency based on urgency and importance of tasks.
Charts Include:
-
Overdue Tasks by Priority – Displays the number of high, medium, and low-priority delays
-
Status Score by Priority – Tracks completion trends for each urgency level
-
Pending Tasks by Priority – Identifies priority levels requiring attention
-
Workload Score by Priority – Monitors workload intensity by priority type
This helps leaders manage high-priority work more effectively.
Click to Buy Office Workflow Efficiency Dashboard in Google Sheets
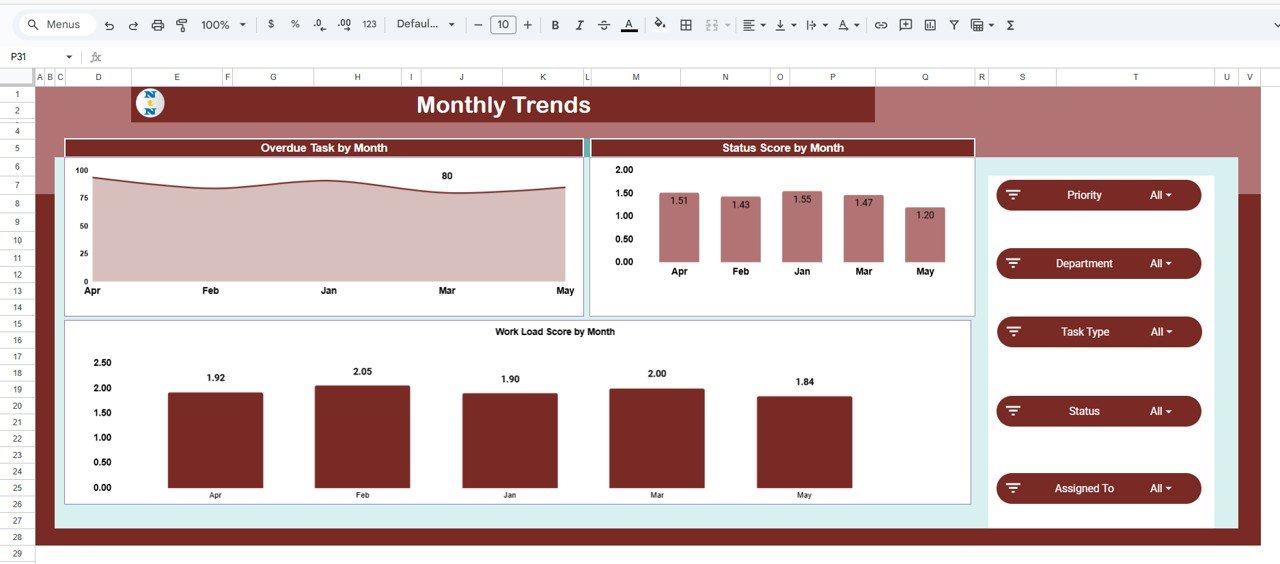
5. Monthly Trends
The Monthly Trends section provides a historical view of workflow efficiency.
Charts Include:
-
Overdue Tasks by Month: Reveals monthly performance fluctuations
-
Status Score by Month: Measures progress trends
-
Workload Score by Month: Analyzes workload changes across months
This tab is perfect for long-term analysis and identifying seasonal patterns in workload and performance.
Click to Buy Office Workflow Efficiency Dashboard in Google Sheets
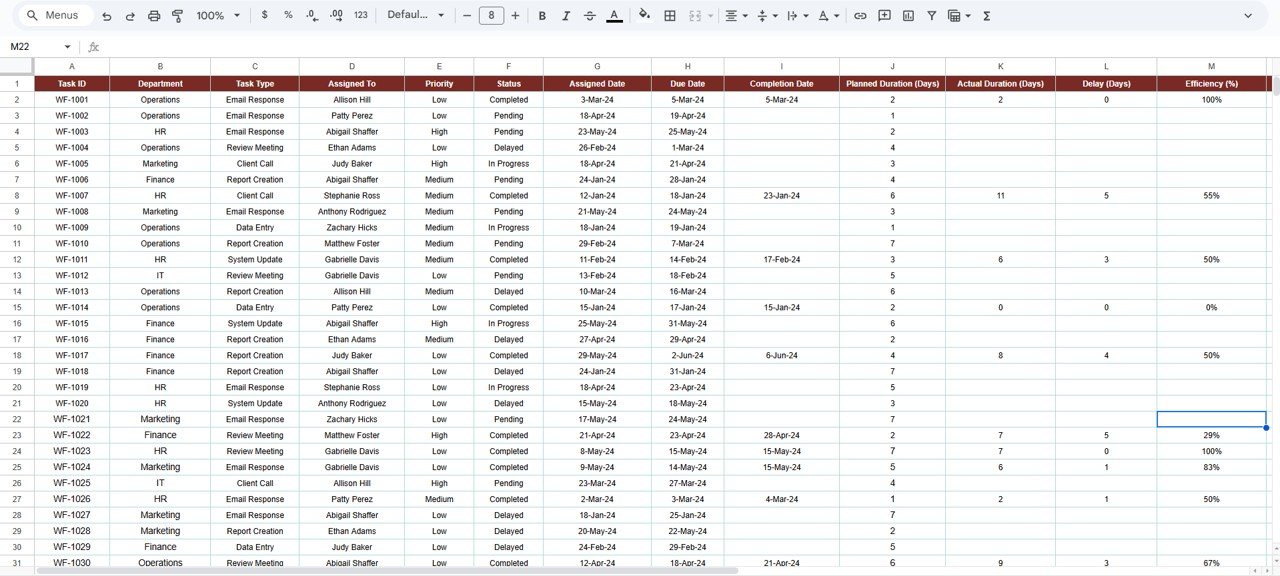
6. Data Sheet Tab
This sheet serves as the data input area, where you can enter details for each task, including:
-
Task name and ID
-
Assigned department or employee
-
Priority level and status
-
Start and due dates
-
Completion details and progress metrics
Updating this sheet automatically refreshes all charts and summaries in real time.
Click to Buy Office Workflow Efficiency Dashboard in Google Sheets
Advantages of Using the Office Workflow Efficiency Dashboard
- Real-Time Insights: Automatically updates task and efficiency data as you input new information.
Improved Decision-Making: Identify workload imbalances and overdue patterns instantly.
Cross-Departmental View: Analyze performance at both individual and departmental levels.
Customizable and Scalable: Easily modify charts or metrics to match your team’s structure.
Google Sheets Collaboration: Access and edit the dashboard from anywhere with your team.
Best Practices for Using the Dashboard
-
Regularly Update the Data Sheet: Keep task records current to ensure accurate analysis.
-
Use Consistent Task Labels: Standardize status and priority fields for uniform results.
-
Review Monthly Trends: Evaluate efficiency and workload changes to identify improvement areas.
-
Balance Workload Across Teams: Use department-level analysis to distribute tasks evenly.
-
Leverage Conditional Formatting: Highlight overdue or high-priority tasks visually for better tracking.
How This Dashboard Helps Your Organization
Click to Buy Office Workflow Efficiency Dashboard in Google Sheets
-
Enhances Transparency: Everyone can view progress and responsibilities in real time.
-
Increases Accountability: Employees stay aware of deadlines and performance expectations.
-
Supports Workflow Optimization: Helps remove inefficiencies and streamline processes.
-
Improves Team Coordination: Aligns departments with organizational goals.
-
Drives Productivity: Encourages timely completion of tasks through data visibility.
Frequently Asked Questions (FAQs)
Q1: Can I customize the metrics shown in this dashboard?
Yes, you can edit or add new metrics in the data sheet and modify charts accordingly.
Q2: How often should I update task data?
Ideally, daily or weekly updates help maintain accuracy and relevance.
Q3: Can I use this dashboard for multiple departments?
Yes, it’s designed to analyze performance across departments and individuals.
Q4: Does it calculate efficiency automatically?
Yes, efficiency is automatically calculated based on task completion and overdue rates.
Q5: Is it suitable for remote teams?
Absolutely. As it’s built in Google Sheets, remote teams can access and collaborate in real time.
Conclusion
Click to Buy Office Workflow Efficiency Dashboard in Google Sheets
The Office Workflow Efficiency Dashboard in Google Sheets is an all-in-one solution for tracking office performance, optimizing workload distribution, and boosting productivity. With dynamic visuals, department-level insights, and trend analysis, this dashboard helps organizations make informed decisions and improve operational efficiency seamlessly.
Visit our YouTube channel to learn step-by-step video tutorials
Youtube.com/@NeotechNavigators
Click to Buy Office Workflow Efficiency Dashboard in Google Sheets