In today’s fast-paced retail industry, businesses operate across multiple channels—online stores, physical retail outlets, marketplaces, and social commerce. Tracking the performance of all these channels in a centralized manner is crucial for making informed decisions, improving customer experiences, and boosting profitability.Omnichannel Retail KPI Dashboard in Google Sheets
Our Omnichannel Retail KPI Dashboard in Google Sheets is a ready-to-use template designed for retailers, store managers, and analysts to monitor key performance indicators (KPIs) across multiple channels effectively. It provides a comprehensive overview of sales, inventory, and customer metrics, enabling businesses to take proactive actions.
This article explains the structure, features, benefits, and best practices of using this dashboard, along with a step-by-step guide for setting up and customizing it.Omnichannel Retail KPI Dashboard in Google Sheets
What is an Omnichannel Retail KPI Dashboard?
An Omnichannel Retail KPI Dashboard is a performance monitoring tool that consolidates key metrics from all retail channels into a single, interactive interface. The dashboard allows businesses to:
-
Track real-time sales and revenue trends across online and offline channels
-
Monitor inventory performance, stock levels, and product turnover
-
Evaluate customer behavior and engagement metrics such as retention, repeat purchase rate, and satisfaction
-
Identify high-performing channels and underperforming areas
-
Compare current performance with targets and historical data
Using Google Sheets for this dashboard offers several advantages:
- Accessibility: Cloud-based access allows team members to view and update data from anywhere.
- Flexibility: Easy to modify KPIs, formulas, or layouts based on business needs.
- Collaboration: Multiple users can collaborate in real-time, making it ideal for cross-functional retail teams.
- Cost-Effective: No expensive BI tools required; uses the familiar Google Sheets interface.
Key Features of the Omnichannel Retail KPI Dashboard
The dashboard is designed with multiple worksheets to manage different aspects of KPI tracking efficiently. Each worksheet serves a specific purpose:
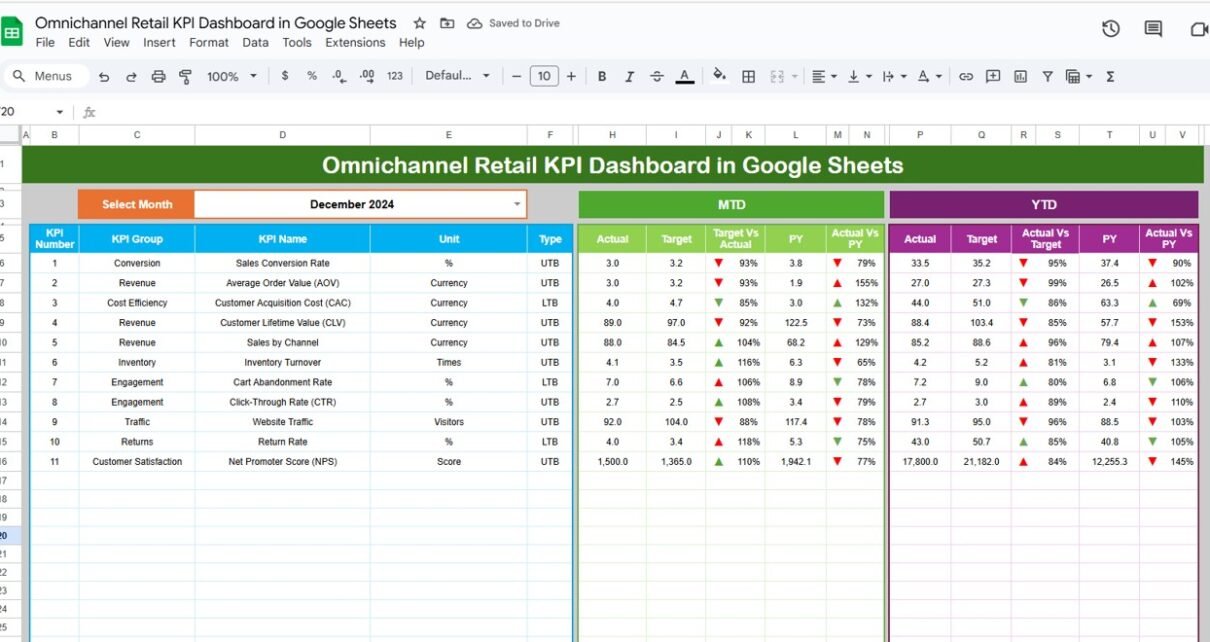
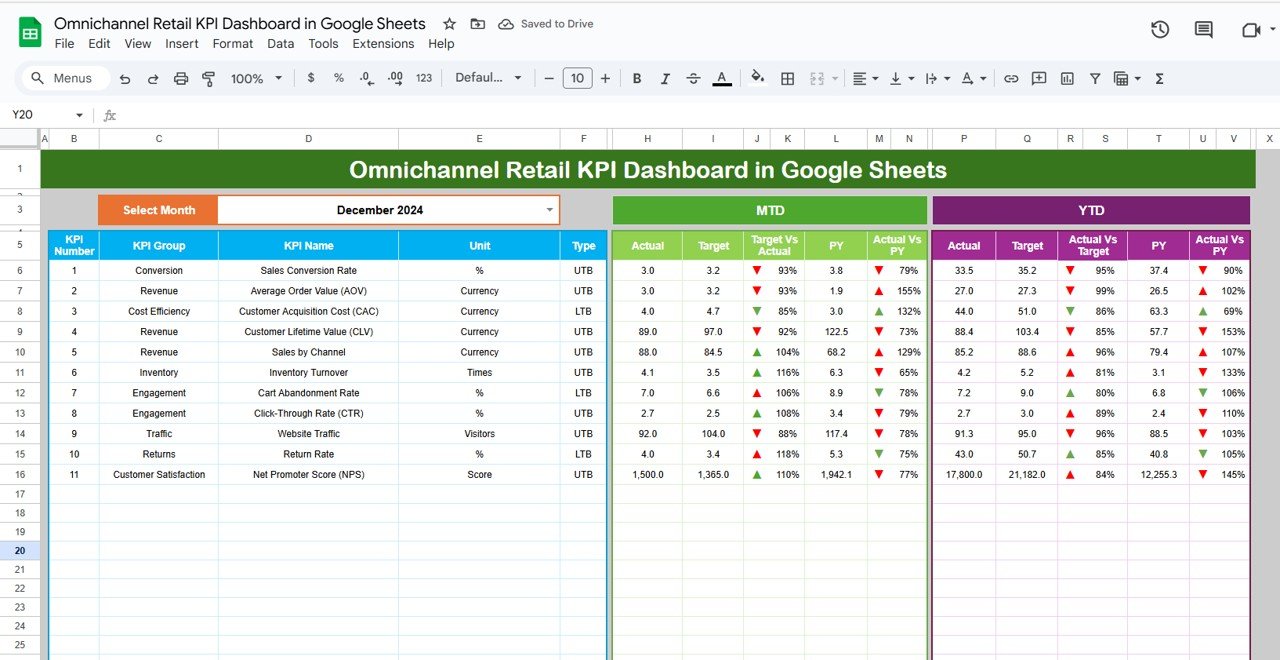
1. Dashboard Sheet Tab
The Dashboard Sheet is the main interface where users can see an overview of all KPIs.
Top Features:
-
Dynamic Month Selector: Using a dropdown on Range D3, users can select any month, and the dashboard updates automatically.
- MTD (Month-to-Date) Actual, Target, Previous Year Data
- YTD (Year-to-Date) Actual, Target, Previous Year Data
Comparisons:
- Target vs Actual
- Previous Year vs Actual
Conditional Formatting: Visual cues such as up/down arrows and color-coded cells for instant insights.
KPIs Covered:
- Sales Revenue: Total revenue across all channels
- Online vs Offline Sales: Split of eCommerce vs physical stores
- Average Order Value (AOV): Average revenue per transaction
- Customer Retention Rate: Percentage of repeat buyers
- Conversion Rate: Percentage of visitors converting to buyers
- Inventory Turnover: Number of times inventory is sold and replaced
- Store Footfall: Physical store visitor numbers
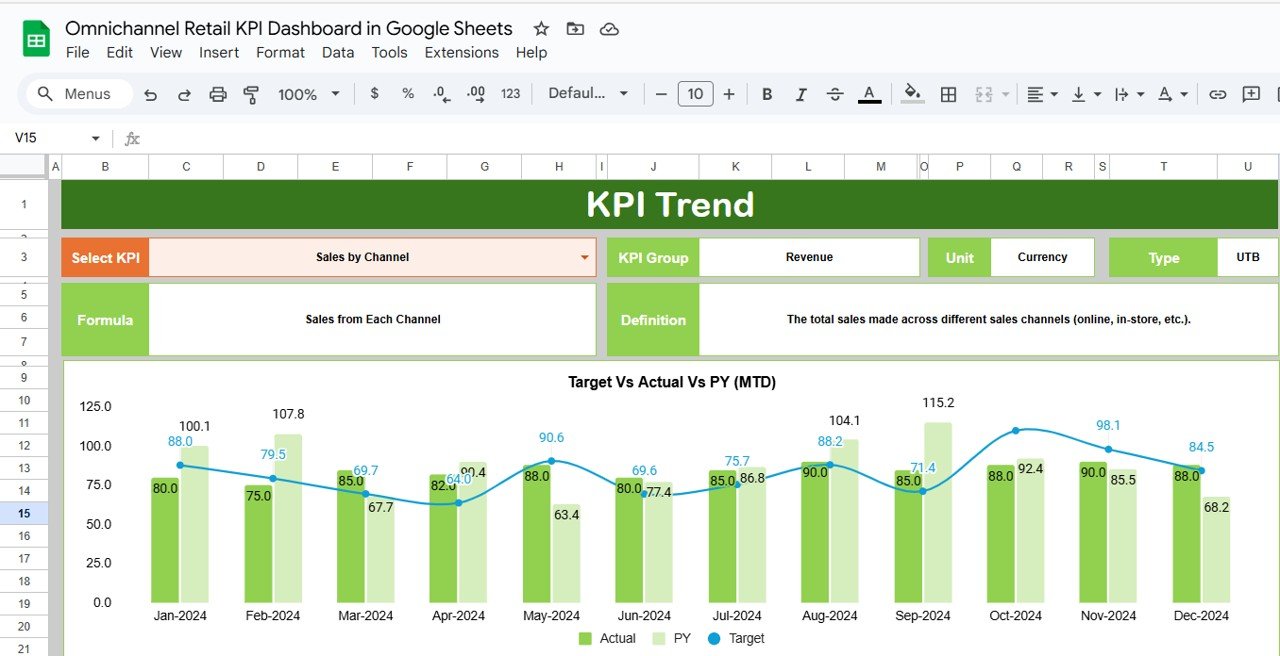
2. KPI Trend Sheet Tab
This sheet allows users to drill down into individual KPIs for detailed analysis.
Features:
KPI Selection Dropdown: Available on Range C3
Displayed Information:
- KPI Group: Sales, Inventory, Customer, or Marketing
- Unit: e.g., $, %, number
- Type: Upper the Better (UTB) or Lower the Better (LTB)
- Formula: How the KPI is calculated
- Definition: Short description for clarity
This sheet helps businesses understand how each KPI is calculated, what it represents, and whether a higher or lower value is desirable.
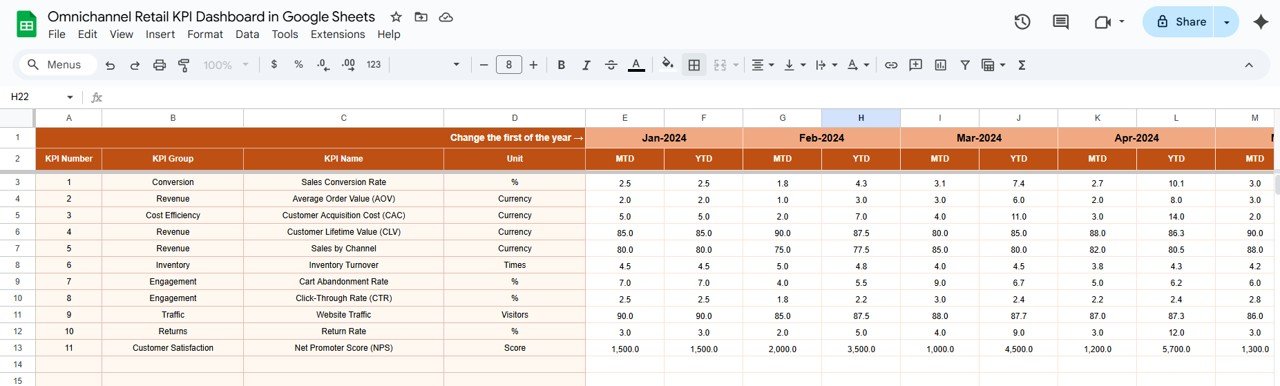
3. Actual Numbers Sheet Tab
The Actual Numbers Sheet is where all real metrics are entered.
Instructions:
-
Enter MTD and YTD actuals for each KPI
-
Change the month in Range E1 to adjust calculations
-
Keep data updated to ensure accurate reporting
This sheet feeds the dashboard with live numbers, making the charts and cards dynamic.
4. Target Sheet Tab
This sheet allows users to set targets for each KPI.
Instructions:
-
Enter monthly MTD and YTD targets for each KPI
-
The dashboard compares actuals against targets to calculate performance percentages and trigger conditional formatting
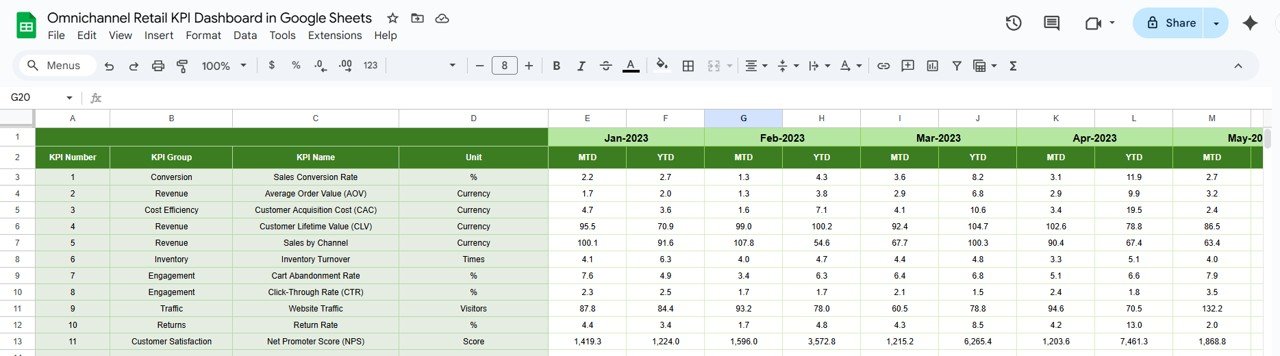
5. Previous Year Numbers Sheet Tab
Historical data is essential for performance comparison.
Instructions:
-
Enter previous year MTD and YTD values
-
Enables the dashboard to show trends, year-over-year growth, and seasonality effects
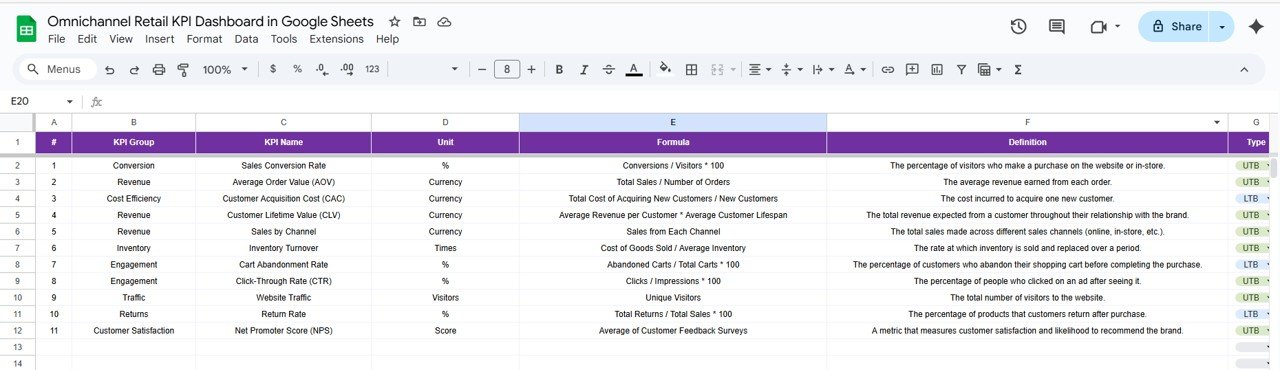
6. KPI Definition Sheet Tab
This is the master reference sheet containing details for all KPIs.
Columns Included:
- KPI Name
- KPI Group
- Unit
- Formula
- KPI Definition
- Type (UTB / LTB)
Maintaining a well-structured KPI definition sheet ensures consistency and prevents errors in reporting.
Benefits of Using This Dashboard
-
Centralized Monitoring: Track online and offline channels in one place
-
Time-Saving: Automatically updates metrics using month and year selectors
-
Data-Driven Decisions: Provides a clear picture of channel performance
-
Conditional Formatting: Highlights KPIs requiring attention
-
Transparency: KPI definitions and formulas make it easy for team members to understand and align
Opportunities for Improvement
-
Automate Data Import: Connect Google Sheets to POS, eCommerce platforms, or CRM systems using APIs
-
Advanced Analytics: Include trendlines, rolling averages, and predictive analytics
-
Alerts and Notifications: Use Google Apps Script to trigger email notifications if KPIs fall below thresholds
-
Segment Analysis: Break down metrics by product category, region, or store location
-
Dashboard Personalization: Allow role-based views for managers, analysts, and executives
Best Practices for Using the Dashboard
-
Update Data Regularly: Enter actuals and targets consistently
-
Review KPI Definitions: Ensure all team members understand what each KPI measures
-
Use Dropdowns: Maintain standardized names for KPIs, departments, and locations
-
Monitor Trends: Analyze month-over-month and year-over-year trends
-
Collaborate: Share the Google Sheet with stakeholders for feedback and data entry
How to Set Up the Omnichannel Retail KPI Dashboard
-
Download the Template: Start with the prebuilt Google Sheets template.
-
Input KPI Definitions: Fill in KPI Name, Group, Unit, Formula, and Type in the KPI Definition sheet.
-
Enter Targets: Populate the Target sheet for MTD and YTD.
-
Add Actual Numbers: Input monthly actuals in the Actual Numbers sheet.
-
Enter Previous Year Data: Add last year’s values to enable comparative analysis.
-
Customize the Dashboard: Adjust colors, conditional formatting rules, and charts as needed.
-
Share with Teams: Grant access to relevant team members for updates and reporting.
Conclusion
The Omnichannel Retail KPI Dashboard in Google Sheets is an essential tool for retailers aiming to unify channel performance, enhance operational efficiency, and make data-driven decisions. By consolidating MTD, YTD, target, and previous year metrics, the dashboard provides a complete view of business health.
Visit our YouTube channel to learn step-by-step video tutorials