In today’s competitive pharmaceutical industry, tracking key performance indicators (KPIs) is essential for monitoring the performance of various processes, improving decision-making, and ensuring efficiency. Whether it’s managing inventory, production cycles, or sales performance, a well-structured KPI dashboard in Google Sheets provides a practical, cost-effective solution for businesses of all sizes. In this article, we’ll dive into the concept of a Pharmaceutical KPI Dashboard in Google Sheets, exploring its features, advantages, and how it can benefit your business operations.
What is a Pharmaceutical KPI Dashboard?
A Pharmaceutical KPI Dashboard is a data visualization tool used to track and monitor essential business metrics that influence the operations of pharmaceutical companies. By leveraging Google Sheets, businesses can create a user-friendly and easily accessible dashboard that tracks critical KPIs such as sales performance, inventory levels, production cycles, and more.
This dashboard allows stakeholders to view real-time data, enabling them to make informed decisions, adjust strategies, and improve performance. The Pharmaceutical KPI Dashboard typically includes several worksheets dedicated to different aspects of performance, including actual numbers, targets, and historical data.
Key Features of the Pharmaceutical KPI Dashboard in Google Sheets
The Pharmaceutical KPI Dashboard in Google Sheets is designed to simplify complex data tracking and make it easier for businesses to manage their performance metrics. The dashboard consists of six key worksheets:
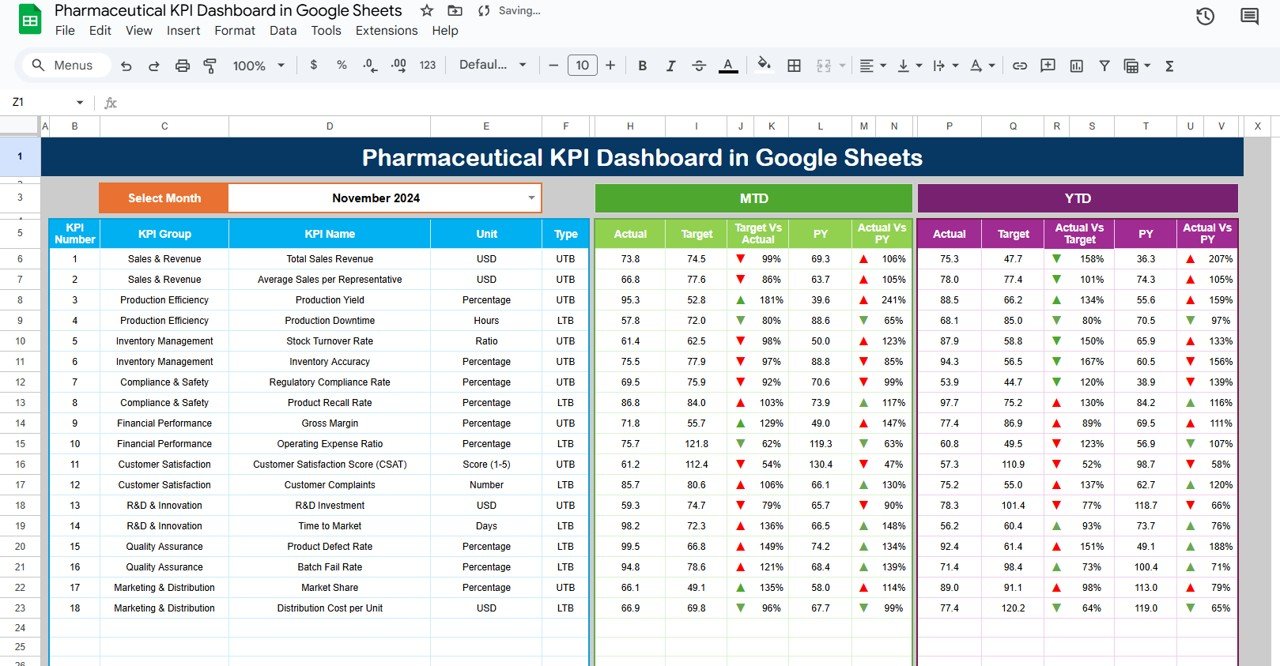
Dashboard Sheet Tab: This is the main sheet where all key data is displayed. Users can select the month from the dropdown in cell D3, and the entire dashboard will update to reflect the relevant figures for that month. The dashboard includes:
- MTD (Month-to-Date) Actuals: Current month’s data compared with targets.
- Target vs. Actuals: Visualized with conditional formatting (up/down arrows).
- PY (Previous Year) vs. Actual: A comparison of current data with the previous year, shown with conditional formatting.
KPI Trend Sheet Tab: This sheet allows users to select a specific KPI name from the dropdown in C3. It displays the following:
- KPI Group
- Unit of KPI
- KPI Type (whether “Lower the Better” or “Upper the Better”)
- Formula of KPI
- Definition of KPI

Actual Number Sheet Tab: In this sheet, users input the actual data for YTD (Year-to-Date) and MTD for a specific month. You can adjust the month for which the data is recorded by changing the month in E1.

Target Sheet Tab: This tab is used to input the target values for each KPI. It includes data for both MTD and YTD targets.

Previous Year Number Sheet Tab: Here, users enter the data for the previous year, allowing for year-over-year comparisons. This data is essential for tracking trends and making improvements.

KPI Definition Sheet Tab: This sheet is dedicated to entering the detailed information about each KPI, including:
- KPI Name
- KPI Group
- Unit
- Formula
- Definition

Advantages of the Pharmaceutical KPI Dashboard
A well-designed Pharmaceutical KPI Dashboard can offer numerous benefits to pharmaceutical companies. Below are some of the key advantages:
- Data Centralization: All performance data is housed in one accessible location. This centralization simplifies data tracking and reporting for team members and stakeholders.
- Real-Time Insights: The ability to select different timeframes and compare current performance with historical data ensures that decisions are made based on the most up-to-date information.
- Enhanced Decision-Making: By visualizing performance metrics, the dashboard helps stakeholders make quick, informed decisions. This leads to more agile and effective management strategies.
- Improved Accountability: With clearly defined KPIs and targets, team members and departments are held accountable for their performance, leading to improved results and productivity.
- Cost-Effective: Google Sheets is a free and powerful tool that eliminates the need for expensive dashboard software while still offering robust functionality.
Opportunities for Improvement in Pharmaceutical KPI Dashboards
While the Pharmaceutical KPI Dashboard in Google Sheets is a powerful tool, there are always opportunities for improvement. Here are some areas to enhance:
- Integration with Other Tools: Integrating the dashboard with other business systems (e.g., ERP or CRM) can automate data entry and provide a more seamless experience.
- Advanced Data Visualizations: Incorporating more advanced charts (e.g., histograms, heat maps, and scatter plots) could enhance the visual appeal and provide more in-depth insights into data trends.
- Mobile Optimization: Making the dashboard mobile-friendly would allow decision-makers to access performance metrics on the go, increasing accessibility and convenience.
- Real-Time Data Updates: Implementing real-time data feeds can ensure the dashboard always reflects the latest business data, improving decision-making speed.
Best Practices for the Pharmaceutical KPI Dashboard
To maximize the effectiveness of your Pharmaceutical KPI Dashboard, it’s important to follow some best practices. Here are some tips for success:
- Set Clear KPIs: Define your KPIs clearly and ensure they are aligned with your company’s strategic goals. Each KPI should be measurable and actionable.
- Use Conditional Formatting Wisely; Leverage conditional formatting (like up/down arrows) to highlight important trends and changes in real-time. This helps stakeholders quickly identify areas that need attention.
- Regularly Update the Dashboard: Ensure that the data in the dashboard is updated regularly, whether it’s monthly or quarterly. This keeps the information relevant and timely.
- Prioritize User-Friendliness: Make sure the dashboard is easy to navigate. Avoid clutter and ensure that users can quickly find the information they need.
- Implement Data Security Measures: Since the dashboard may contain sensitive information, make sure to implement necessary security measures to protect the data, such as restricting access or using password protection.
Conclusion
The Pharmaceutical KPI Dashboard in Google Sheets is an invaluable tool for pharmaceutical companies seeking to streamline their data management, track essential performance metrics, and make informed decisions. With its user-friendly interface, real-time data tracking, and customizable features, this dashboard can transform the way your business manages its operations. By following the best practices and continuously improving the dashboard, you can ensure that it remains a powerful tool for performance analysis and decision-making.
Frequently Asked Questions
1. What are KPIs in a Pharmaceutical Dashboard?
KPIs (Key Performance Indicators) are metrics that help businesses track their performance in various areas. In a pharmaceutical dashboard, KPIs might include sales numbers, inventory turnover, production efficiency, and more.
2. How can I use Google Sheets for my Pharmaceutical KPI Dashboard?
Google Sheets is an excellent tool for creating a KPI dashboard due to its ease of use, real-time collaboration, and accessibility. You can input data, set targets, and visualize KPIs all in one place.
3. Can I customize the Pharmaceutical KPI Dashboard for my needs?
Yes, the Pharmaceutical KPI Dashboard is highly customizable. You can adjust KPIs, formulas, and target values to fit your specific business needs.
4. How often should I update the data in the dashboard?
You should update the dashboard regularly, typically monthly or quarterly, to ensure the data remains relevant and accurate.
5. Can I integrate the dashboard with other systems?
Yes, integrating your KPI dashboard with other business systems, such as ERP or CRM software, can help automate data entry and improve accuracy.
Visit our YouTube channel to learn step-by-step video tutorials
Youtube.com/@NeotechNavigators