Podcast success depends on understanding audience behavior, tracking performance, and measuring engagement. The Podcast Performance KPI Dashboard in Google Sheets provides a complete, ready-to-use solution to track every key metric — from listens to completion rate — all inside a simple, visual, and automated dashboard.
Podcast Performance KPI Dashboard in Google SheetsPodcast Performance KPI Dashboard in Google Sheets
This dashboard helps podcast creators, marketing teams, content managers, and agencies monitor growth, compare performance across episodes, and measure progress against monthly targets.Podcast Performance KPI Dashboard in Google Sheets
What Is a Podcast Performance KPI Dashboard in Google Sheets?
Click to Buy Podcast Performance KPI Dashboard in Google Sheets
The Podcast Performance KPI Dashboard is a centralized KPI-tracking system designed to monitor podcast audience growth, engagement, and content performance.
Podcast Performance KPI Dashboard in Google Sheets
It visualizes real-time numbers, compares them with targets, shows monthly and yearly trends, and highlights improvement areas using conditional formatting and KPI scoring.
You can instantly view MTD Actuals, YTD performance, targets, previous year data, and KPI trends through one easy-to-use Google Sheets dashboard.
Dashboard Structure
This dashboard includes 6 worksheets, each built for clarity, accuracy, and performance tracking.
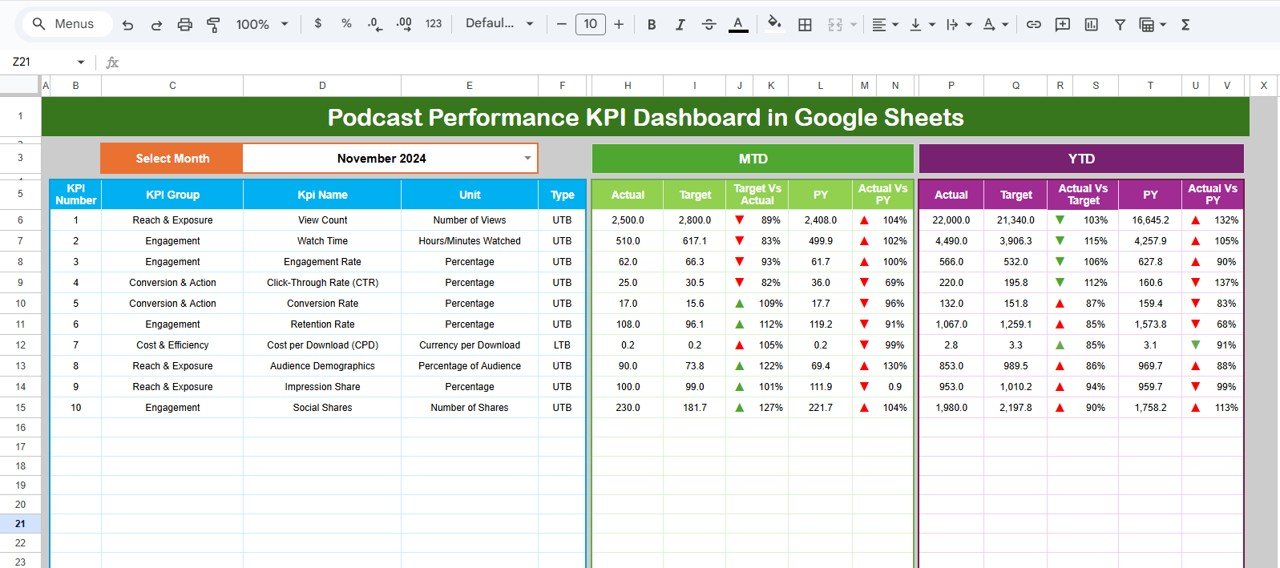
2: Dashboard Sheet Tab
This is the main dashboard tab, displaying all podcast KPIs and performance summaries.
Key Features:
-
Month selection available at Range D3
-
Dashboard auto-updates for the selected month
-
MTD: Actual, Target, Previous Year, Target vs Actual, PY vs Actual
-
YTD: Actual, Target, Previous Year, Target vs Actual, PY vs Actual
-
Conditional formatting with up/down arrows for instant insights
The dashboard shows:
-
Which KPI hit the target
-
Which KPI exceeded last year’s performance
-
Which KPI requires improvement
This tab acts as the central view for all stakeholders.
Click to Buy Podcast Performance KPI Dashboard in Google Sheets
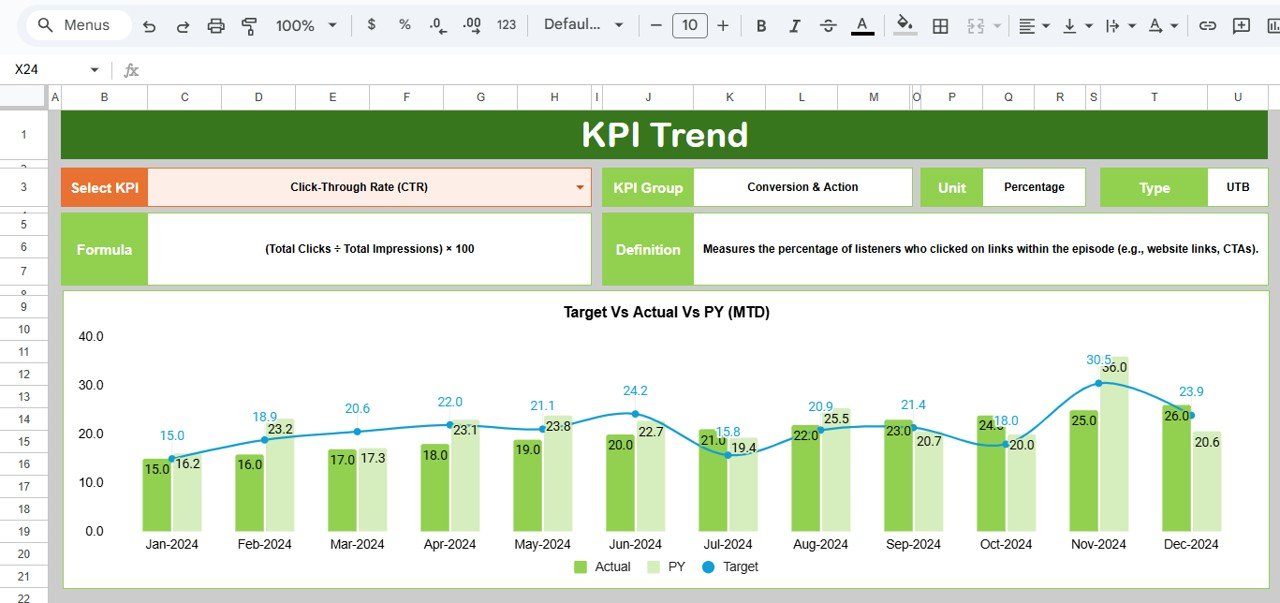
3: KPI Trend Sheet Tab
This sheet allows users to analyze trends for individual KPIs.
Key Features:
-
Select a KPI using the dropdown in Range C3
-
Displays KPI Group, Unit, and Type (Lower the Better / Upper the Better)
-
Shows KPI Formula
-
Shows KPI Definition
-
Helps users understand how the KPI is calculated
-
Highlights performance patterns across months
This sheet is ideal for deep-dive analytics and understanding KPI behavior.
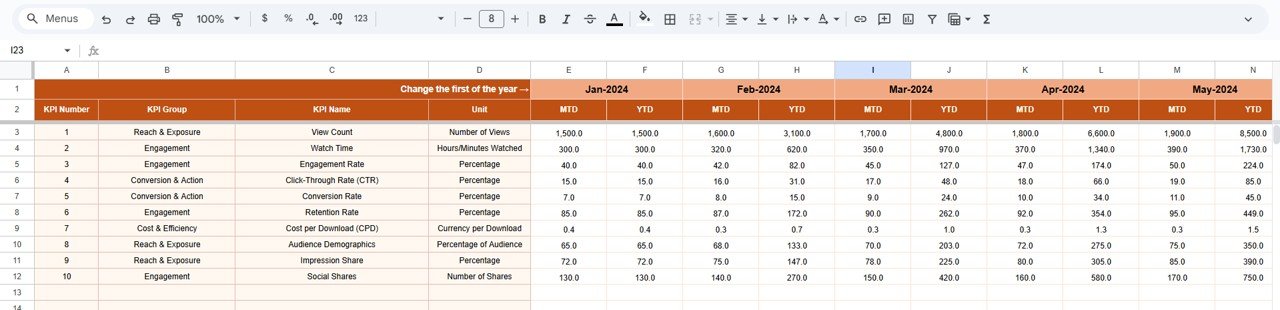
4: Actual Number Sheet Tab
This tab stores the actual numbers of each KPI.
Key Features:
-
Enter MTD and YTD actual values for each month
-
Select the year’s starting month in Range E1
-
Supports dynamic month-to-month updates
-
Ensures the dashboard always reflects accurate real-time data
All calculations in the dashboard depend on this sheet.
Click to Buy Podcast Performance KPI Dashboard in Google Sheets
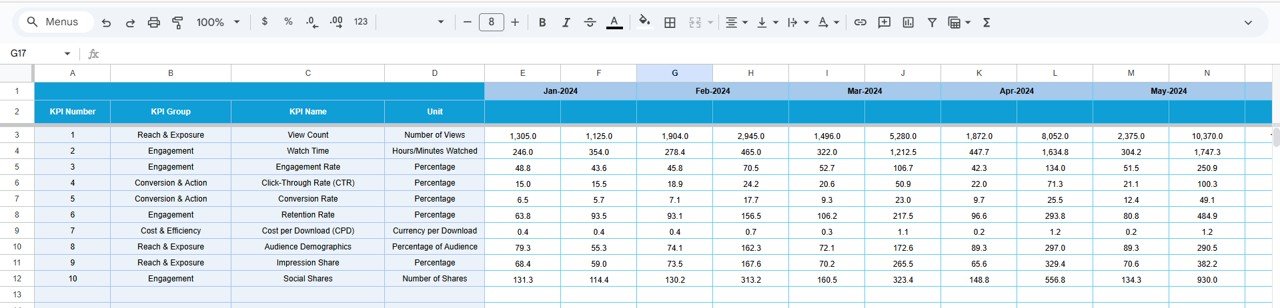
5: Target Sheet Tab
This sheet allows you to enter targets for each KPI.
Key Features:
-
Enter MTD and YTD targets for every KPI
-
Monthly breakdown for precise performance tracking
-
Ensures alignment with business goals
-
Helps evaluate performance vs. expectations
Ideal for content strategy and planning.
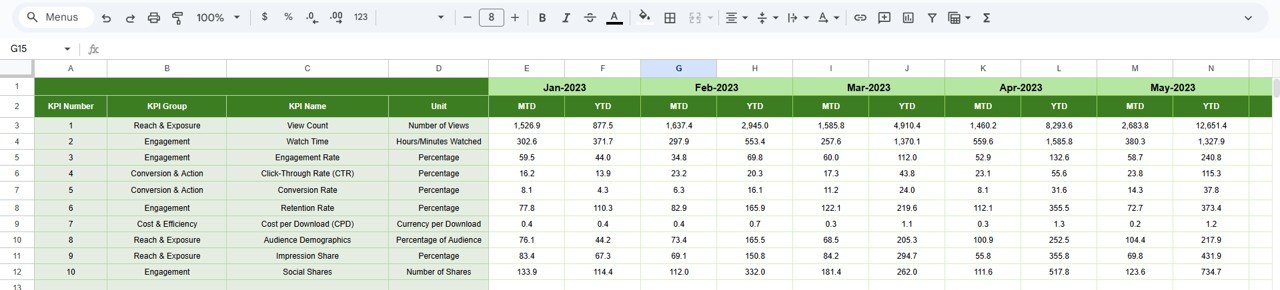
6: Previous Year Number Sheet Tab
This sheet stores historical performance data.
Key Features:
-
Enter previous year’s KPI numbers
-
Structure matches the current year’s format
-
Enables year-over-year growth comparison
-
Helps understand long-term podcast performance trends
Useful for tracking improvement and setting future targets.
Click to Buy Podcast Performance KPI Dashboard in Google Sheets
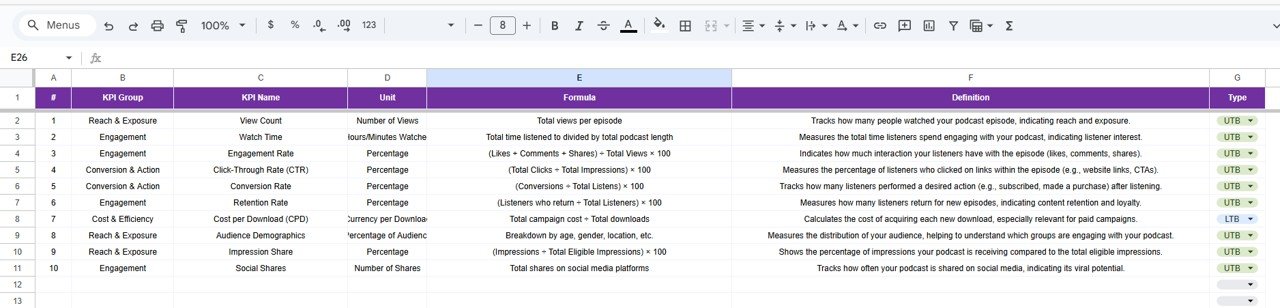
7: KPI Definition Sheet Tab
This sheet contains the complete list of KPIs, including:
-
KPI Name
-
KPI Group
-
Unit
-
Formula
-
Definition
-
KPI Type (UTB – Upper the Better / LTB – Lower the Better)
This helps users understand the logic behind every metric.
Below is the complete KPI definition table for this dashboard.
Advantages of Podcast Performance KPI Dashboard in Google Sheets
🎙️ Complete Performance Visibility
Track listens, subscribers, ratings, revenue, and engagement in one place.
📊 Smart KPI Comparisons
View MTD, YTD, target vs actual, and PY vs actual.
⚡ Real-Time Insights
The dashboard updates instantly when data changes.
🔧 Fully Customizable
Add new KPIs, charts, goals, or metrics easily.
☁️ Cloud-Based Collaboration
Work with your team in real time using Google Sheets.
Opportunities for Improvement
Click to Buy Podcast Performance KPI Dashboard in Google Sheets
-
Add charts for episode-to-episode comparison
-
Include automated alerts for low completion rate
-
Add listener demographic charts
-
Use Google Forms for collecting listener feedback
-
Create a content calendar sheet for planning new episodes
Best Practices
-
Update monthly actual values on time
-
Review subscriber growth weekly
-
Track completion rate to identify weak episodes
-
Compare revenue KPIs monthly for monetization insights
-
Set realistic targets using previous year data
Conclusion
Click to Buy Podcast Performance KPI Dashboard in Google Sheets
The Podcast Performance KPI Dashboard in Google Sheets offers a complete performance monitoring solution for podcasters and marketing teams. By tracking listens, engagement, subscribers, revenue, and trends — this dashboard ensures clear insights and helps improve content, marketing, and growth strategy.
Visit our YouTube channel to learn step-by-step video tutorials
Youtube.com/@NeotechNavigators
Watch the step-by-step video Demo:
Click to Buy Podcast Performance KPI Dashboard in Google Sheets