The Precious Metals KPI Dashboard in Google Sheets is a dynamic, ready-to-use analytical tool designed to help precious metals traders, refiners, and manufacturers track performance across production, sales, pricing, quality, and operational efficiency.Precious Metals KPI Dashboard in Google Sheets
From monitoring purity levels and refining yields to analyzing sales margins and inventory turnover, this dashboard provides a complete real-time overview of key metrics — all within the simplicity and flexibility of Google Sheets.Precious Metals KPI Dashboard in Google Sheets
What Is a Precious Metals KPI Dashboard?
The Precious Metals KPI Dashboard is a data visualization system that consolidates multiple operational and financial indicators into a single Google Sheets interface.
It allows decision-makers to track performance for metals like gold, silver, platinum, and palladium, ensuring each department — from mining to refining to trading — can measure progress against monthly and yearly targets.
Users can view MTD (Month-to-Date) and YTD (Year-to-Date) values, compare them with targets and previous year’s performance, and identify opportunities for process improvement using automated up/down indicators.
Dashboard Structure
Click to Buy Precious Metals KPI Dashboard in Google Sheets
This Google Sheets dashboard is divided into six interactive and functional worksheets:
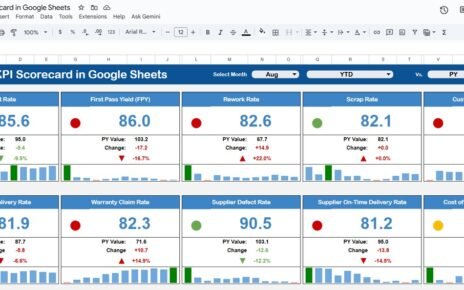
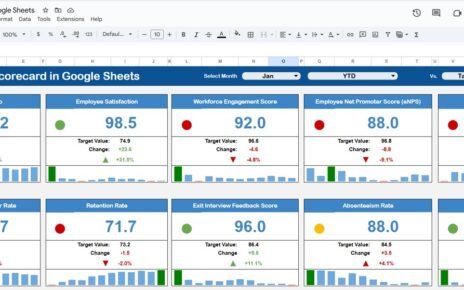
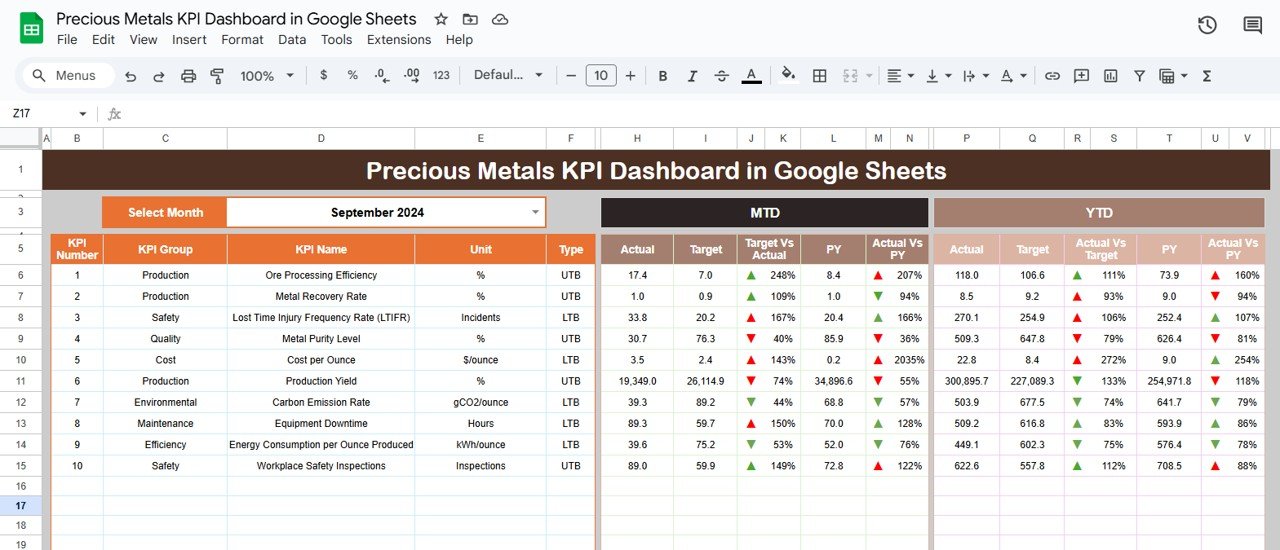
Dashboard Sheet Tab
The Dashboard is the control center that displays summarized insights across all performance metrics.
-
The Month Selector (cell D3) lets you pick any month to refresh all visuals.
-
The sheet showcases MTD and YTD Actuals vs. Targets with conditional formatting for easy interpretation.
-
Green arrows (↑) represent better-than-target performance, while red arrows (↓) indicate underperformance.
KPI Cards Displayed:
- Total Metal Produced (oz)
- Total Metal Sold (oz)
- Average Purity (%)
- Refining Yield (%)
- Cost per Ounce (USD)
- Revenue per Ounce (USD)
- Average Market Price (USD/oz)
- Gross Margin (%)
- Inventory Turnover Ratio
- Delivery On-Time (%)
Click to Buy Precious Metals KPI Dashboard in Google Sheets
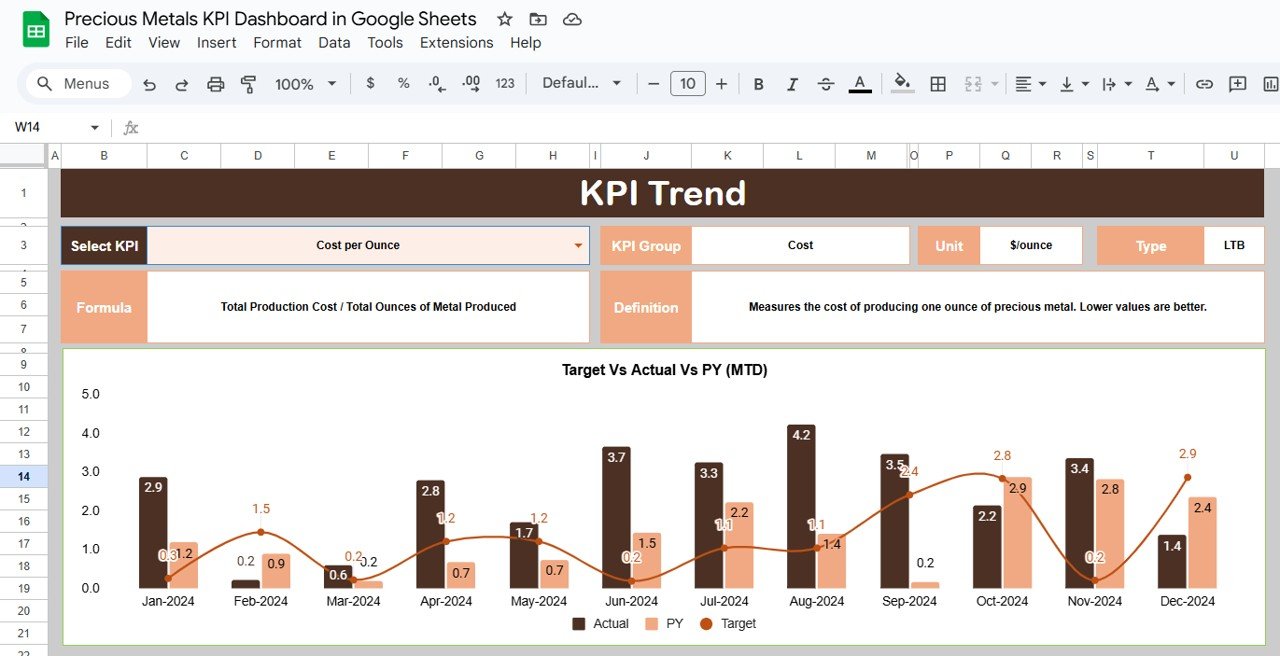
KPI Trend Sheet Tab
This tab provides a deep dive into the trend of each KPI.
-
Select the KPI name using the dropdown in Range C3.
-
View the KPI’s group, unit, formula, type (UTB/LTB), and definition.
-
Analyze MTD and YTD trend lines across months for performance evaluation.
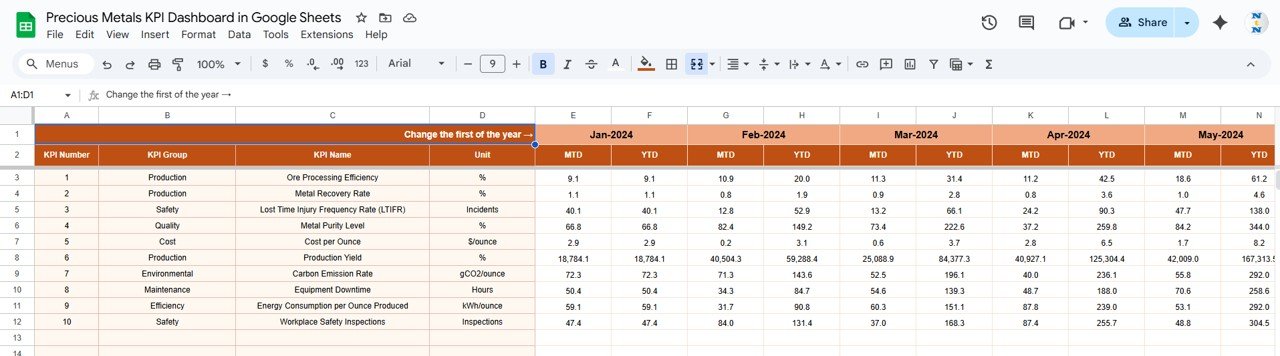
Actual Number Sheet Tab
This tab stores monthly performance data for each KPI.
-
Input MTD and YTD actual figures.
-
Update cell E1 to set the reference month and see real-time dashboard updates.
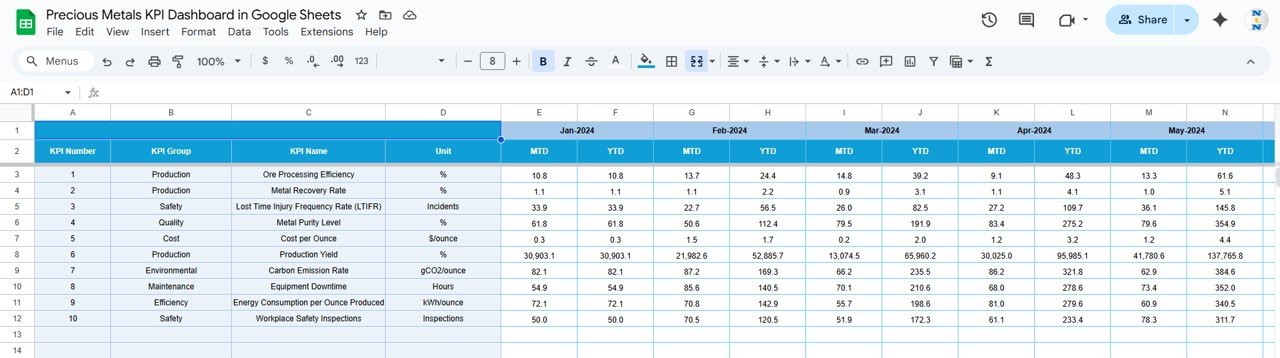
Target Sheet Tab
Click to Buy Precious Metals KPI Dashboard in Google Sheets
Enter your MTD and YTD target values for each KPI to enable accurate performance comparison.
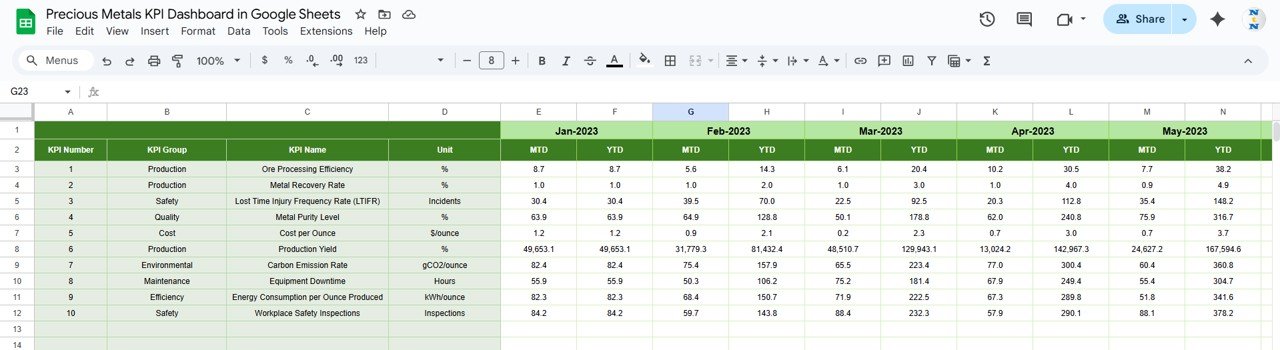
Previous Year Number Sheet Tab
Holds last year’s performance data for historical and year-over-year analysis.
Click to Buy Precious Metals KPI Dashboard in Google Sheets
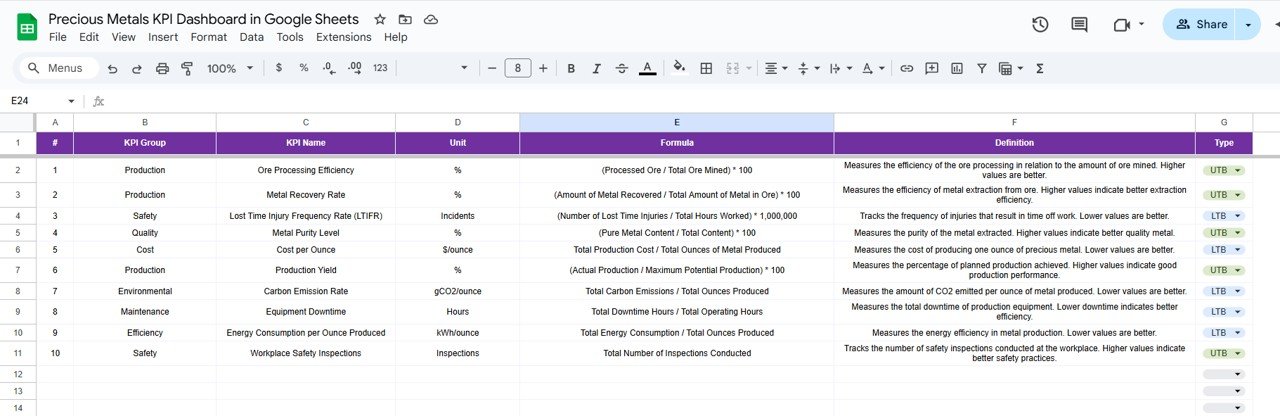
KPI Definition Sheet Tab
Defines each KPI with its unit, formula, meaning, and performance type (UTB or LTB).
Advantages
Click to Buy Precious Metals KPI Dashboard in Google Sheets
-
🪙 Comprehensive Performance Tracking: Covers production, quality, cost, and sales in one sheet.
-
📊 Visual Intelligence: View instant insights through dynamic cards and charts.
-
⚙️ Automated Calculations: Formulas instantly update when new data is entered.
-
☁️ Cloud-Based Collaboration: Manage your performance across teams using Google Sheets.
-
💹 Multi-Level Analysis: Evaluate performance by month, year, or department.
Opportunities for Improvement
-
Integrate live market price feeds from sources like Kitco or LME for real-time pricing.
-
Add forecasting models for production and sales trends.
-
Include metal type filters (Gold, Silver, Platinum, etc.).
-
Add cost variance analysis by department or process.
-
Use Google Apps Script to auto-send monthly performance reports.
Best Practices
Click to Buy Precious Metals KPI Dashboard in Google Sheets
-
Update production, sales, and pricing data monthly.
-
Cross-verify purity and yield entries with lab reports.
-
Benchmark performance against market and previous year averages.
-
Review KPI trends monthly to spot inefficiencies early.
-
Secure the “Target” and “KPI Definition” sheets to avoid accidental edits.
Conclusion
The Precious Metals KPI Dashboard in Google Sheets is a powerful analytical solution for tracking production, quality, cost, and profitability in real time.
Whether you’re managing a gold refinery, a silver trading desk, or a jewelry manufacturing unit, this dashboard helps transform complex data into actionable insights — enabling smarter decisions, tighter control, and higher profitability.
Visit our YouTube channel to learn step-by-step video tutorials
Youtube.com/@NeotechNavigators
Watch the step-by-step video Demo: