Preventive maintenance plays a critical role in reducing equipment breakdowns, controlling maintenance costs, and improving asset life. However, many organizations still track maintenance activities using manual logs, scattered spreadsheets, or static reports. As a result, overdue tasks increase, costs rise unexpectedly, and decision-making becomes reactive.
That is exactly where a Preventive Maintenance Dashboard in Google Sheets becomes extremely valuable.
In this article, we will explain the Preventive Maintenance Dashboard in Google Sheets, its structure, pages, KPIs, advantages, and best practices. This is a ready-to-use dashboard designed to help maintenance teams track performance clearly and efficiently.
What Is a Preventive Maintenance Dashboard in Google Sheets?
A Preventive Maintenance Dashboard in Google Sheets is an interactive and visual reporting tool that tracks maintenance activities, costs, schedules, and performance metrics in one centralized place.
Instead of reviewing raw maintenance logs, this dashboard displays key insights using KPI cards, charts, slicers, and trend analysis. Moreover, since it is built in Google Sheets, teams can access and update it in real time.
As a result, maintenance managers gain full visibility into scheduled, completed, and overdue maintenance activities.
Why Do You Need a Preventive Maintenance Dashboard?
Click to Buy Preventive Maintenance Dashboard in Google Sheets
Preventive maintenance involves multiple variables such as equipment, technicians, maintenance types, frequency, cost, and status. Therefore, manual tracking creates gaps and delays.
Without a dashboard:
- Overdue maintenance increases
- Maintenance costs remain unclear
- Technician workload becomes unbalanced
- Equipment failures occur more frequently
However, a Preventive Maintenance Dashboard in Google Sheets centralizes all maintenance data. Consequently, teams can act proactively instead of reacting to failures.
How Does the Preventive Maintenance Dashboard Work?
The dashboard works through a simple and effective flow:
- Maintenance data is entered into structured data tables
- Users apply slicers such as Month, Maintenance Type, Frequency, Status, Technician, and Equipment
- KPI cards and charts update automatically
- Trends and problem areas become visible instantly
Because of this design, users can analyze maintenance performance without editing formulas.
Key Features of the Preventive Maintenance Dashboard in Google Sheets
Click to Buy Preventive Maintenance Dashboard in Google Sheets
This ready-to-use dashboard includes powerful features designed for real-world maintenance operations.
Interactive Filters (Slicers)
The dashboard includes slicers for:
- Month
- Maintenance Type
- Frequency
- Status
- Technician
- Equipment
These slicers allow users to filter all visuals instantly.
KPI Cards for Quick Insights
At the top of the dashboard, KPI cards display:
- Number of maintenance activities
- Total maintenance cost
- Average maintenance cost
- Scheduled maintenance count
- Completed maintenance count
As a result, management can review performance at a glance.
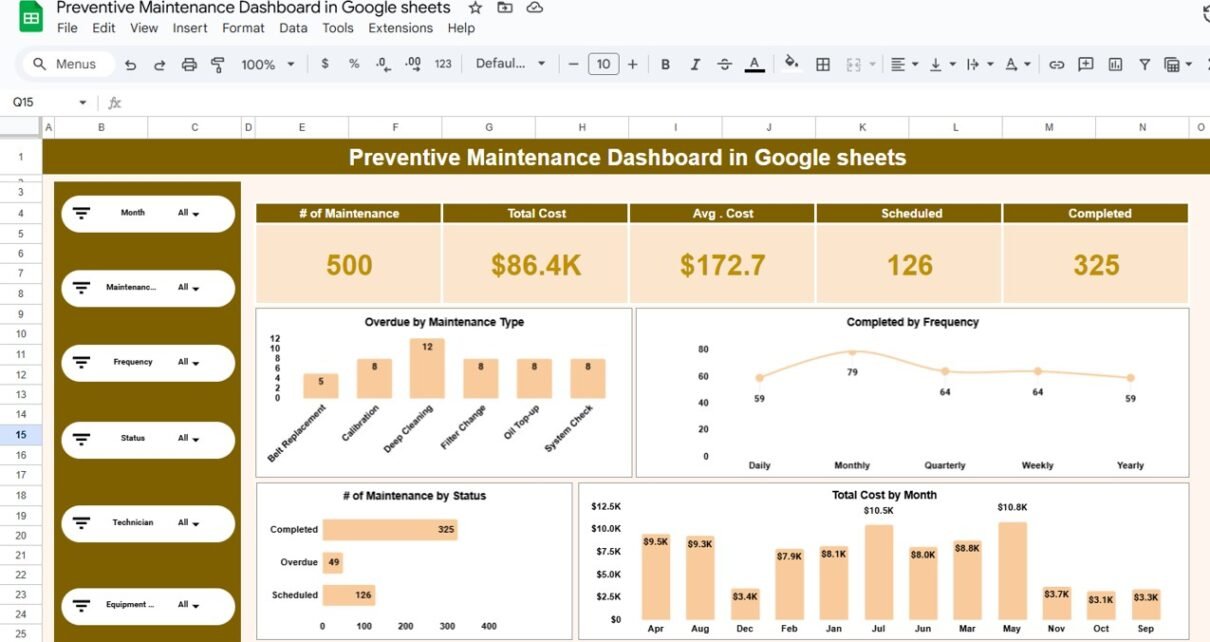
Overview Page:
The Overview Page provides a complete snapshot of preventive maintenance performance.
Key Visuals on the Overview Page:
-
Overdue maintenance by maintenance type
-
Completed maintenance by frequency
-
Number of maintenance by status
-
Total maintenance cost by month
This page helps teams quickly identify cost spikes, overdue tasks, and workload distribution.

Click to Buy Preventive Maintenance Dashboard in Google Sheets
Equipment Wise Analysis:
The Equipment Wise Analysis page focuses on asset-level insights.
Key Insights on This Page:
-
Total maintenance cost by equipment
-
Scheduled maintenance by equipment
-
Completed maintenance by equipment
-
Overdue maintenance by equipment
Because of this view, maintenance teams can identify high-cost or high-risk equipment easily.

Click to Buy Preventive Maintenance Dashboard in Google Sheets
Maintenance Wise Analysis:
The Maintenance Wise Analysis page analyzes performance by maintenance type.
Charts Included:
- Total cost by maintenance type
- Scheduled maintenance by maintenance type
- Completed maintenance by maintenance type
- Overdue maintenance by maintenance type
As a result, teams can prioritize critical maintenance activities and optimize schedules.

Click to Buy Preventive Maintenance Dashboard in Google Sheets
Frequency Wise Analysis:
The Frequency Wise Analysis page highlights how maintenance frequency impacts cost and performance.
Key Metrics on This Page:
- Total cost by frequency (Daily, Monthly, Quarterly, Weekly, Yearly)
- Scheduled maintenance by frequency
- Completed maintenance by frequency
- Overdue maintenance by frequency
This analysis helps optimize maintenance intervals and reduce unnecessary work.

Click to Buy Preventive Maintenance Dashboard in Google Sheets
Technician Wise Analysis: How Do Technicians Perform?
The Technician Wise Analysis page focuses on workforce performance.
Key Visuals:
- Total cost by technician
- Scheduled maintenance by technician
- Completed maintenance by technician
- Overdue maintenance by technician
Because of this page, managers can balance workloads and improve accountability.

Click to Buy Preventive Maintenance Dashboard in Google Sheets
What KPIs Can You Track Using This Dashboard?
This Preventive Maintenance Dashboard allows tracking of critical KPIs such as:
- Total maintenance activities
- Scheduled vs completed maintenance
- Overdue maintenance count
- Maintenance cost
- Average cost per maintenance
- Equipment-wise cost
- Technician productivity
- Maintenance frequency effectiveness
These KPIs support both operational and strategic decisions.
Advantages of Preventive Maintenance Dashboard in Google Sheets
Click to Buy Preventive Maintenance Dashboard in Google Sheets
Centralized Maintenance Visibility
All maintenance data stays in one place. Therefore, reporting becomes consistent and reliable.
Reduced Equipment Downtime
Early identification of overdue maintenance helps prevent breakdowns.
Better Cost Control
Cost trends highlight overspending areas instantly.
Improved Technician Productivity
Technician-wise analysis improves workload planning.
Real-Time Collaboration
Google Sheets allows multiple users to work together seamlessly.
No Complex Software Required
You get powerful analytics without expensive CMMS or BI tools.
Best Practices for Preventive Maintenance Dashboard in Google Sheets
Click to Buy Preventive Maintenance Dashboard in Google Sheets
Keep Data Accurate and Timely
Always update maintenance records regularly.
Standardize Maintenance Types and Status
Use consistent naming such as Scheduled, Completed, and Overdue.
Review Overdue Tasks Weekly
Proactive reviews reduce equipment risk.
Protect Calculation Areas
Lock formulas and charts to avoid accidental changes.
Use Monthly Reviews
Analyze trends monthly to improve preventive strategies.
Who Should Use This Preventive Maintenance Dashboard?
Click to Buy Preventive Maintenance Dashboard in Google Sheets
This dashboard is ideal for:
- Maintenance managers
- Facility managers
- Plant operations teams
- Manufacturing units
- Hospitals and campuses
- Service and utilities companies
Because it uses Google Sheets, adoption is quick and simple.
Conclusion: Is the Preventive Maintenance Dashboard in Google Sheets Worth It?
Click to Buy Preventive Maintenance Dashboard in Google Sheets
The Preventive Maintenance Dashboard in Google Sheets transforms raw maintenance data into clear, actionable insights. It improves planning, reduces downtime, controls costs, and enhances accountability.
If you want a ready-to-use, interactive, and easy-to-manage preventive maintenance solution, this dashboard delivers exactly what your organization needs.
Frequently Asked Questions (FAQs)
What is a Preventive Maintenance Dashboard in Google Sheets?
It is a ready-to-use dashboard that tracks maintenance schedules, costs, equipment, and technician performance.
Can I filter data by equipment and technician?
Yes, interactive slicers allow filtering across all analysis pages.
Do I need advanced Google Sheets skills?
No, basic Google Sheets knowledge is enough to use this dashboard.
Can I customize KPIs and visuals?
Yes, the dashboard is fully customizable.
Can multiple users access the dashboard?
Yes, Google Sheets supports real-time collaboration.
Visit our YouTube channel to learn step-by-step video tutorials
Youtube.com/@NeotechNavigators
Watch the step-by-step video tutorial:
Click to Buy Preventive Maintenance Dashboard in Google Sheets