In private equity, tracking performance is critical to assess investments, returns, and operational efficiency. The Private Equity KPI Dashboard in Google Sheets is designed to provide an organized, real-time view of key performance indicators (KPIs), enabling private equity firms to make data-driven decisions.
In this article, we will explore the Private Equity KPI Dashboard in Google Sheets, a ready-to-use template for private equity firms to track essential KPIs. This guide will provide details on the dashboard’s features, the KPIs it tracks, and how it can be customized for your firm’s needs.
Key Features of the Private Equity KPI Dashboard in Google Sheets
Below are the key features of this dashboard template:
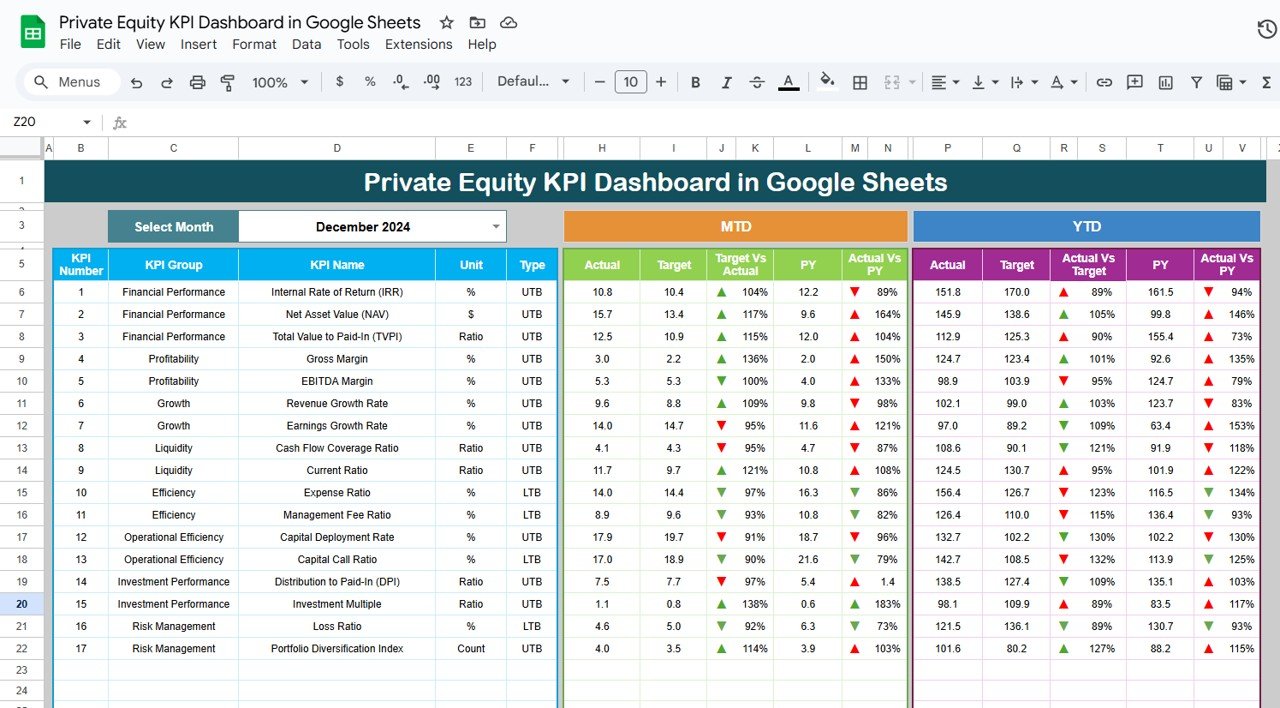
1. Dashboard Sheet Tab
This is the main sheet where all KPI data is displayed.
-
Month Selection: In Range D3, select the month from the drop-down menu, and the dashboard will update to show data for that month.
-
MTD (Month-to-Date): Displays actual numbers, target numbers, and previous year data with comparisons and conditional formatting (up or down arrows).
-
YTD (Year-to-Date): Shows cumulative performance with comparisons to target and previous year data.

Click to buy Private Equity KPI Dashboard in Google Sheets
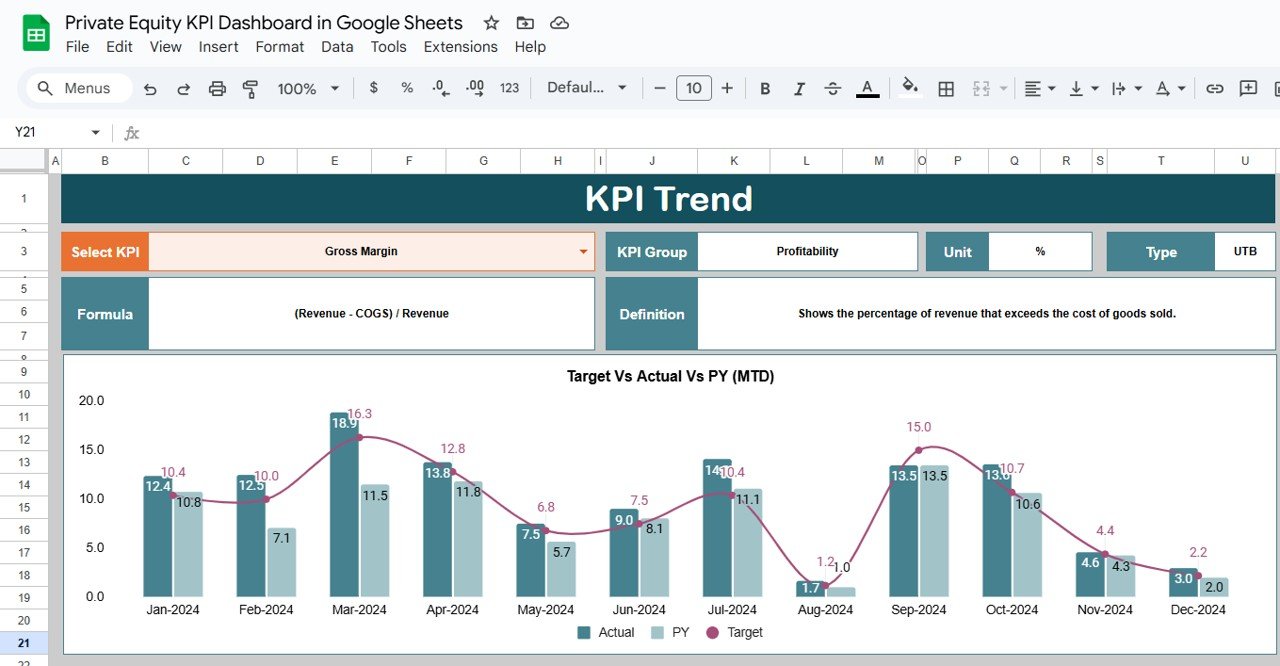
2. KPI Trend Sheet Tab
-
Select KPIs from the dropdown in Range C3.
-
Displays KPI group, unit of measurement, type (Lower the Better or Upper the Better), formula, and KPI definition.
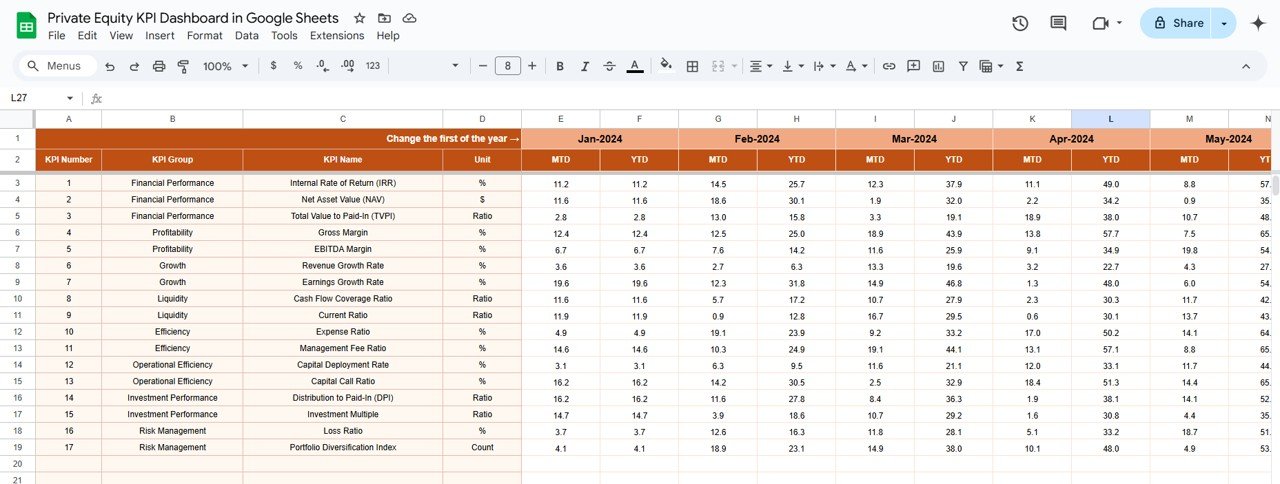
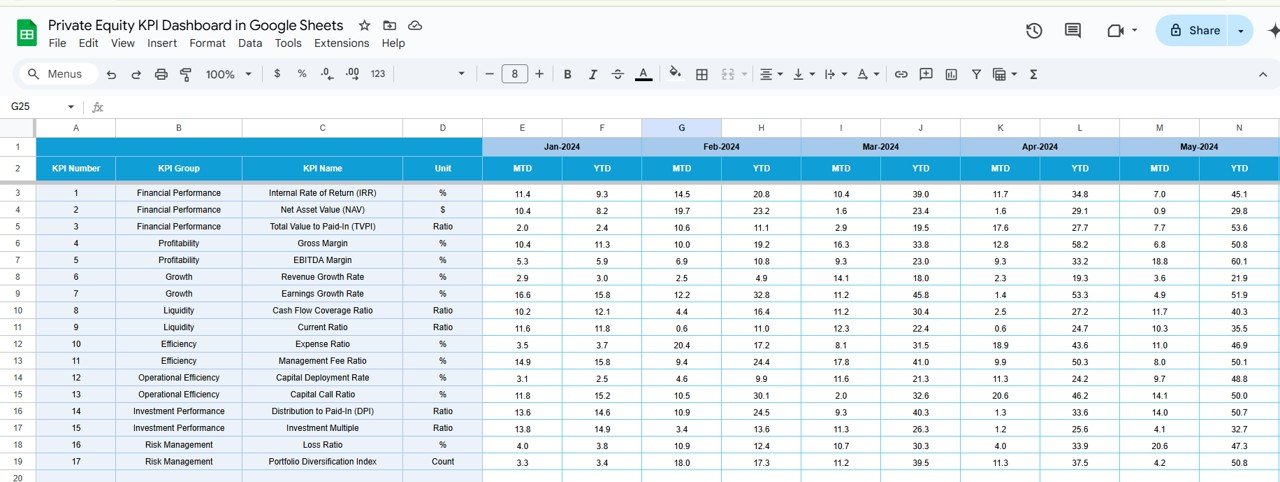
3. Actual Number Sheet Tab
-
Input actual numbers for YTD and MTD for the selected month.
-
Change the month from Range E1 to input the first month of the year.
Click to buy Private Equity KPI Dashboard in Google Sheets
4. Target Sheet Tab
-
Enter target values for each KPI for MTD and YTD.
-
Helps track performance against the set goals.
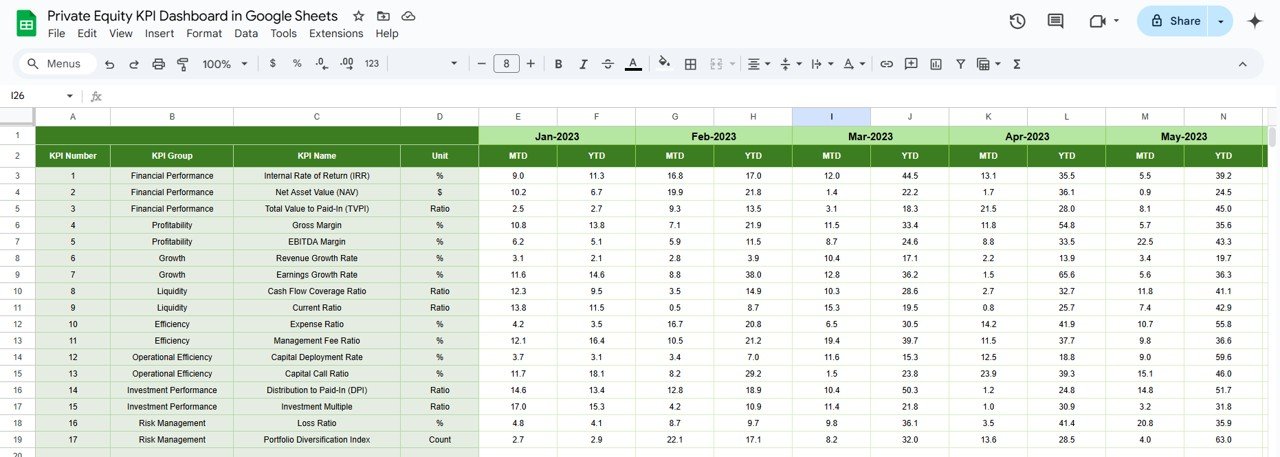
5. Previous Year Number Sheet Tab
-
Enter the previous year’s data for year-over-year comparison.
-
Use the same format as the current year to maintain consistency.
Click to buy Private Equity KPI Dashboard in Google Sheets
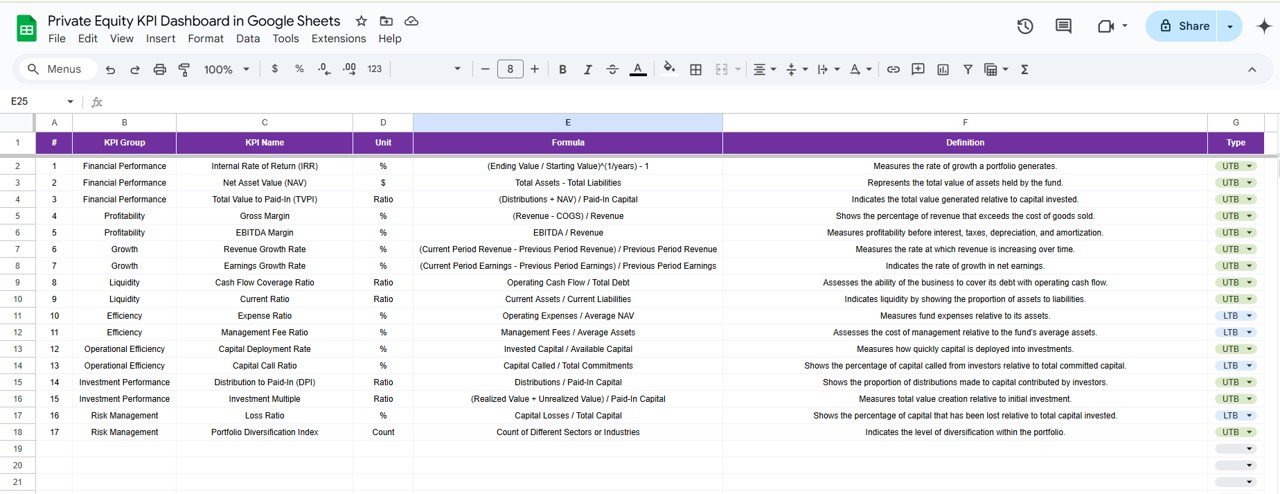
6. KPI Definition Sheet Tab
Contains detailed information for each KPI, including:
- KPI Name
- KPI Group
- Unit of Measure
- Formula for KPI Calculation
- Definition of the KPI
Advantages of Using the Private Equity KPI Dashboard in Google Sheets
The Private Equity KPI Dashboard in Google Sheets offers several benefits:
-
Real-Time Monitoring: Track and monitor KPIs in real-time to make quick, informed decisions.
-
Customizable Templates: Easily modify the dashboard to fit your firm’s specific KPIs, financial goals, and investment strategy.
-
Cost-Effective: Google Sheets is a free and accessible tool, making it a great option for private equity firms of all sizes.
-
Cloud-Based Collaboration: Multiple team members can collaborate in real-time, ensuring everyone is aligned and informed.
-
Accessibility: Access and update the dashboard from any device with internet connectivity, ensuring flexibility for the entire team.
Opportunities for Improvement in the Private Equity KPI Dashboard
Click to buy Private Equity KPI Dashboard in Google Sheets
While the Private Equity KPI Dashboard in Google Sheets is an effective tool, there are opportunities for improvement:
Automating Data Entry:
- Current Challenge: Manual data entry can be prone to errors and time-consuming.
- Opportunity: Integrating the dashboard with external systems (e.g., portfolio management software, CRM) can automate data entry and improve accuracy.
Advanced Visualizations:
- Current Challenge: The dashboard currently uses basic charts and graphs.
- Opportunity: Adding more advanced visualizations, such as sparklines, heatmaps, and interactive charts, can improve data interpretation and decision-making.
Customizable Reporting:
- Current Challenge: Reporting features are limited to basic metrics.
- Opportunity: Expand reporting capabilities by adding options for exporting data to PDF, generating automated email reports, and creating custom reports based on specific metrics.
Best Practices for Using the Private Equity KPI Dashboard
To maximize the benefits of the Private Equity KPI Dashboard in Google Sheets, consider these best practices:
-
Update Regularly: Ensure data is updated at least monthly to maintain accurate and relevant insights into portfolio performance.
-
Set Realistic Targets: Base your KPIs on historical performance data and industry benchmarks to set achievable goals.
-
Review Periodically: Regularly review KPIs to evaluate the performance of your portfolio and adjust strategies as necessary.
-
Leverage Conditional Formatting: Use conditional formatting to provide instant visual cues on performance trends, such as up/down arrows or color coding.
-
Encourage Team Collaboration: Share the dashboard with relevant team members and stakeholders to align on goals and strategies.
Conclusion
The Private Equity KPI Dashboard in Google Sheets is a powerful tool that allows private equity firms to track and monitor essential performance metrics in real-time. By utilizing this dashboard, firms can make more informed decisions, optimize their portfolios, and ultimately achieve greater investment success.
Frequently Asked Questions (FAQs)
What is a KPI in private equity?
A KPI (Key Performance Indicator) is a measurable value used to evaluate the success of investments in private equity. Common KPIs include IRR, MOIC, and cash-on-cash return.
How can I customize my Private Equity KPI Dashboard?
The dashboard is highly customizable, allowing you to add, remove, or modify KPIs and adjust formulas based on your firm’s investment goals.
How do I enter data into the Private Equity KPI Dashboard?
Enter actual numbers for MTD and YTD in the relevant sheets (Actual Numbers Sheet, Target Sheet, Previous Year Numbers Sheet) for each month.
Can I automate the data entry process?
Yes, you can integrate the dashboard with external systems like CRM or portfolio management software to automate data entry and reduce errors.
What KPIs should I track in private equity?
Essential KPIs for private equity include IRR, MOIC, exit multiple, portfolio company growth, and debt-to-equity ratio.
Visit our YouTube channel to learn step-by-step video tutorials
Youtube.com/@NeotechNavigators