Product development is a critical aspect of any business, as it drives innovation and ensures that a company can meet market demands. Monitoring the right key performance indicators (KPIs) is essential for tracking the success of product development efforts. The Product Development KPI Dashboard in Google Sheets helps businesses track, analyze, and improve their product development process by providing insights into key metrics.
In this article, we will walk you through the features of the Product Development KPI Dashboard and explain how it can help you streamline your product development process.
What is the Product Development KPI Dashboard in Google Sheets?
The Product Development KPI Dashboard in Google Sheets is a ready-to-use template designed to track essential metrics related to product development. The dashboard enables businesses to monitor various KPIs such as development time, resource utilization, product performance, and customer feedback.
This Google Sheets dashboard helps teams stay organized by providing real-time data on product development efforts, ensuring that all stakeholders are aligned and that goals are met efficiently.
Key Features of the Product Development KPI Dashboard
The Product Development KPI Dashboard consists of several worksheets that provide insights into various aspects of the product development lifecycle. Below are the key features of each worksheet:
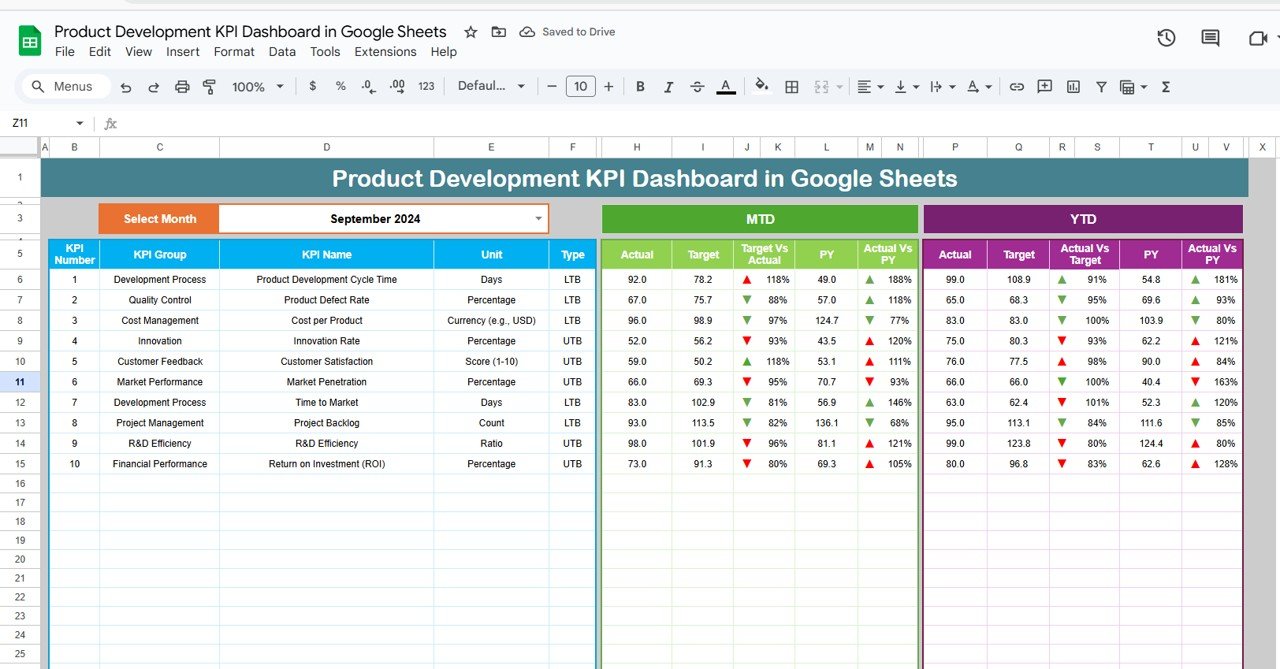
1. Dashboard Sheet Tab
The Dashboard Sheet is the main tab where all KPIs are displayed in one place. Key features include:
Month Selection (D3): Select the month to update the entire dashboard with the relevant data for that month.
Key Metrics:
- MTD Actual, Target, Previous Year Data: Track the actual progress of product development for the current month, compare it to the target, and compare it with previous year’s data.
- YTD Actual, Target, Previous Year Data: Track year-to-date progress and compare it against the target and last year’s performance.
-
Conditional Formatting: Use up and down arrows to indicate whether the KPI is meeting or falling short of the target.

Click to buy Product Development KPI Dashboard in Google Sheets
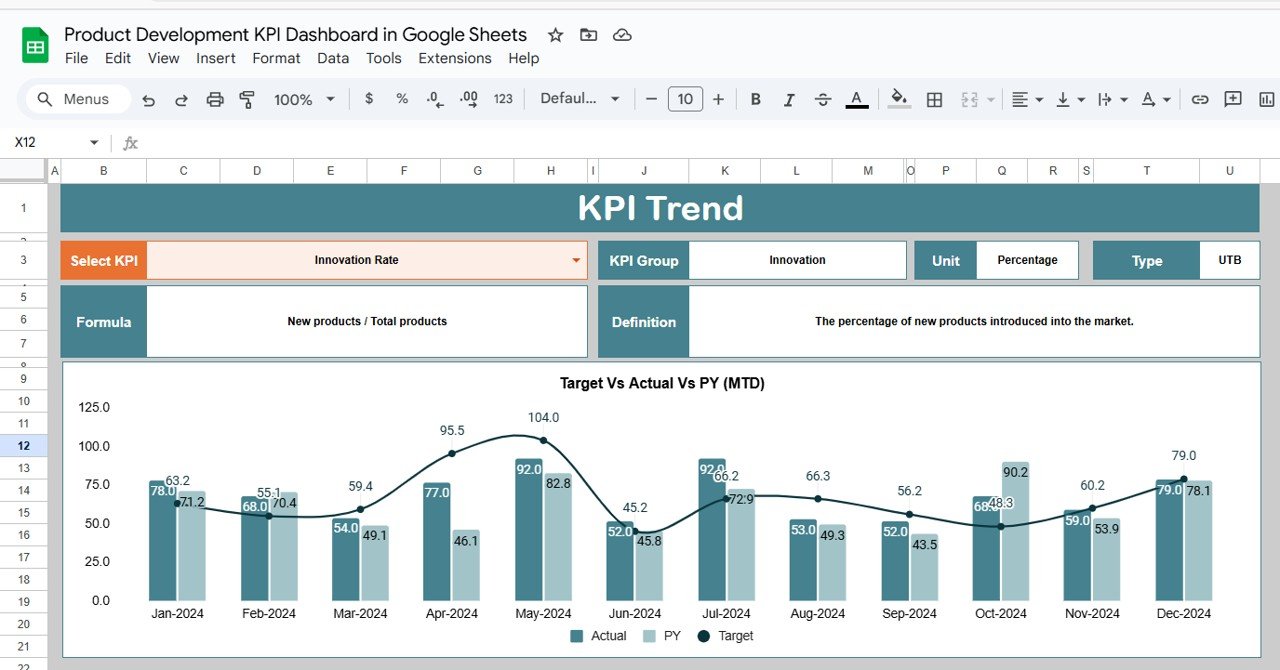
2. KPI Trend Sheet Tab
The KPI Trend Sheet allows you to view the performance trends of selected KPIs over time.
-
KPI Selection (C3): Choose the KPI to track from the dropdown menu.
-
KPI Group, Unit, and Type: This section provides the group (e.g., development timeline, quality), unit of measurement (e.g., hours, percentage), and type (whether the KPI is “Lower the Better” or “Upper the Better”).
-
Formula and Definition: Explains how each KPI is calculated and its relevance to the product development process.
Click to buy Product Development KPI Dashboard in Google Sheets
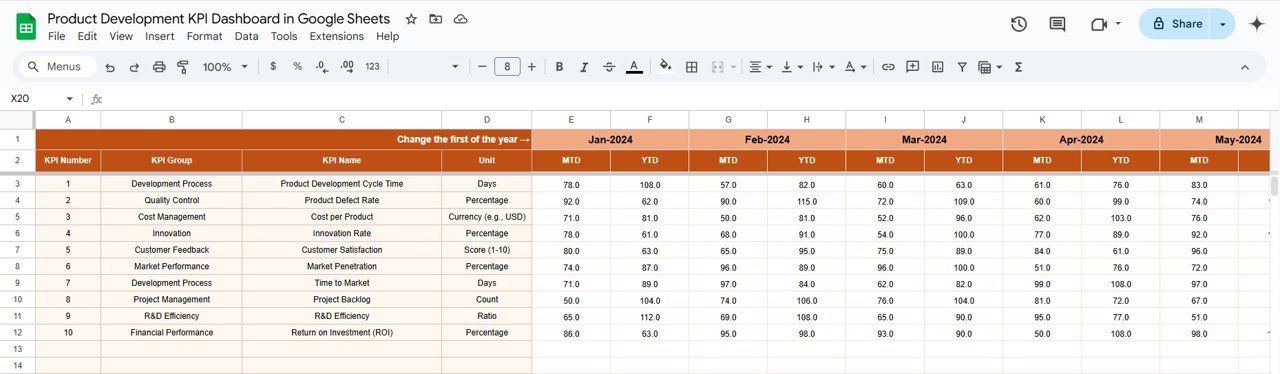
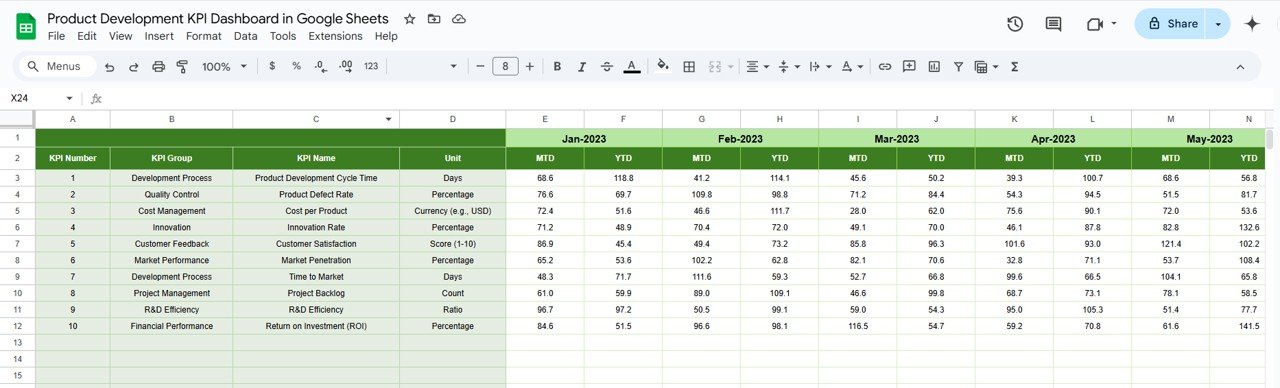
3. Actual Number Sheet Tab
This sheet is used to input actual performance data for your KPIs.
-
MTD and YTD Data: Enter the actual values for the current month (MTD) and year-to-date (YTD) to keep the dashboard up-to-date.
4. Target Sheet Tab
The Target Sheet allows you to enter target values for each KPI:
-
Monthly and YTD Targets: Input the target numbers for each KPI for the current month and year-to-date. These will be used to compare against actual data.

Click to buy Product Development KPI Dashboard in Google Sheets
5. Previous Year Numbers Sheet Tab
Track performance data from the previous year in this sheet for comparison purposes:
-
Historical Data: Enter the previous year’s data to analyze trends and assess whether current performance is improving.
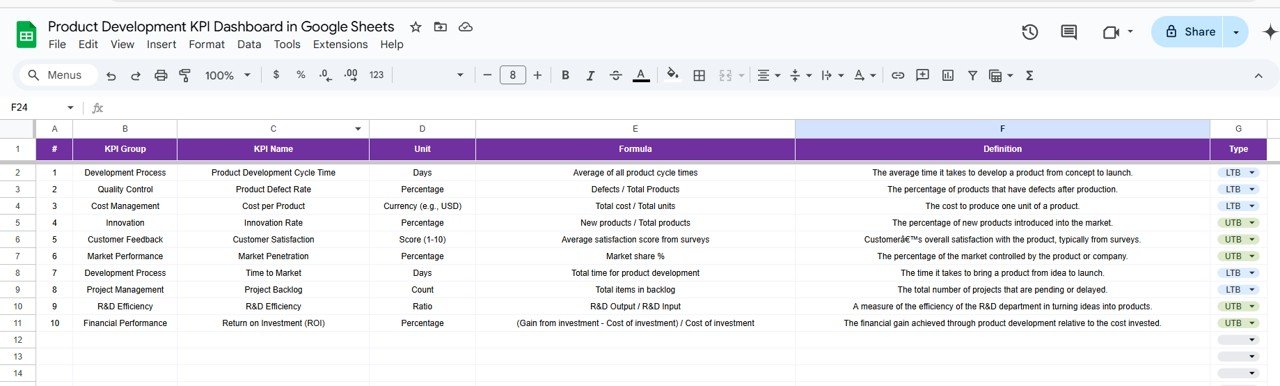
6. KPI Definition Sheet Tab
The KPI Definition Sheet provides an overview of each KPI:
-
KPI Name, Group, Unit: Lists the name, group, and unit of each KPI.
-
Formula and Definition: Provides a clear definition of each KPI and its calculation formula, helping stakeholders understand its significance.
Click to buy Product Development KPI Dashboard in Google Sheets
Advantages of Using the Product Development KPI Dashboard
The Product Development KPI Dashboard offers several advantages for businesses looking to optimize their product development process:
-
Comprehensive Tracking: Monitor multiple aspects of product development, such as cost, quality, and time to market, in one place.
-
Real-Time Data: Keep the dashboard up-to-date with real-time data, ensuring accurate and timely insights.
-
Data-Driven Decisions: Use the data from the dashboard to make informed decisions about resource allocation, timeline adjustments, and quality improvements.
-
Customizable: The dashboard is highly customizable to fit your specific product development needs, allowing you to track the KPIs that matter most to your business.
Opportunity for Improvement in the Product Development KPI Dashboard
Click to buy Product Development KPI Dashboard in Google Sheets
While the Product Development KPI Dashboard is an effective tool, there are several opportunities for improvement:
-
Automated Data Integration: Integrating the dashboard with your existing project management or ERP software could automate data entry, reducing manual work and improving accuracy.
-
Mobile Access: Creating a mobile-friendly version of the dashboard would allow team members to track KPIs on the go.
-
Advanced Predictive Analytics: Adding forecasting capabilities would allow businesses to predict future product development trends and outcomes based on historical data.
-
Cross-Department Insights: Integrating data from other departments, such as marketing and sales, could provide a more holistic view of the product development lifecycle.
Best Practices for Using the Product Development KPI Dashboard
To maximize the benefits of the Product Development KPI Dashboard, follow these best practices:
-
Update the Dashboard Regularly: Keep the data up-to-date to ensure accurate insights and timely decision-making.
-
Set Realistic Targets: Make sure your targets are achievable and aligned with overall business goals to avoid setting unrealistic expectations.
-
Use Data Insights for Continuous Improvement: Analyze trends and identify areas for improvement to enhance your product development processes over time.
-
Collaborate Across Teams: Share the dashboard with different departments (e.g., R&D, marketing, production) to ensure everyone is aligned and working towards common goals.
-
Monitor Trends: Regularly check trends in KPIs like Time to Market and Customer Satisfaction to assess whether product development is on track.
Conclusion
Click to buy Product Development KPI Dashboard in Google Sheets
The Product Development KPI Dashboard in Google Sheets is an invaluable tool for businesses looking to track and optimize their product development processes. With KPIs such as Time to Market, Development Cost per Product, and Customer Satisfaction, the dashboard provides key insights that help businesses make data-driven decisions, optimize resources, and bring products to market more efficiently. By using this dashboard, businesses can enhance their product development strategy and stay competitive in today’s fast-paced market.
Frequently Asked Questions (FAQs)
1. What KPIs are tracked in the Product Development KPI Dashboard?
The dashboard tracks KPIs such as Time to Market, Development Cost per Product, Customer Satisfaction, and more.
2. Can I customize the Product Development KPI Dashboard?
Yes, the dashboard is highly customizable, allowing you to add new KPIs or adjust the layout to suit your needs.
3. How do I update the Product Development KPI Dashboard?
Simply enter actual data for each KPI in the Actual Numbers Sheet and update targets in the Target Sheet.
4. Can I integrate the dashboard with other systems?
Yes, you can integrate the dashboard with project management or ERP software to automate data updates and improve accuracy.
5. How often should I update the Product Development KPI Dashboard?
It is recommended to update the dashboard regularly, especially when new data is available, such as the end of the month or quarter.
Visit our YouTube channel to learn step-by-step video tutorials
Youtube.com/@NeotechNavigators
Watch the step-by-step video Demo:
Click to buy Product Development KPI Dashboard in Google Sheets