Tracking the success of multiple projects requires consistent performance monitoring. The Project Management KPI Scorecard in Google Sheets is a ready-to-use template designed to simplify performance tracking using visual scorecards, dynamic indicators, and trend analysis.Project Management KPI Scorecard in Google Sheets
In this article, we’ll explain how this KPI Scorecard works, its key features, advantages, and best practices for effective use.Project Management KPI Scorecard in Google Sheets
What Is a Project Management KPI Scorecard in Google Sheets?
A KPI Scorecard is a management tool that measures and monitors critical project performance metrics. In project management, KPIs (Key Performance Indicators) help assess efficiency, quality, and progress across various projects.
Using Google Sheets, this scorecard provides:
-
Interactive month selection for real-time data updates
-
Traffic light indicators (red, yellow, green) for KPI performance
-
Up and down arrows to show progress trends
-
MTD (Month-to-Date) and YTD (Year-to-Date) performance views
This makes it easy for managers to analyze progress, identify risks, and ensure alignment with organizational goals.
Key Features of the Project Management KPI Scorecard in Google Sheets
Click to Buy Project Management KPI Scorecard in Google Sheets
This template is structured into several worksheets, each serving a distinct purpose.
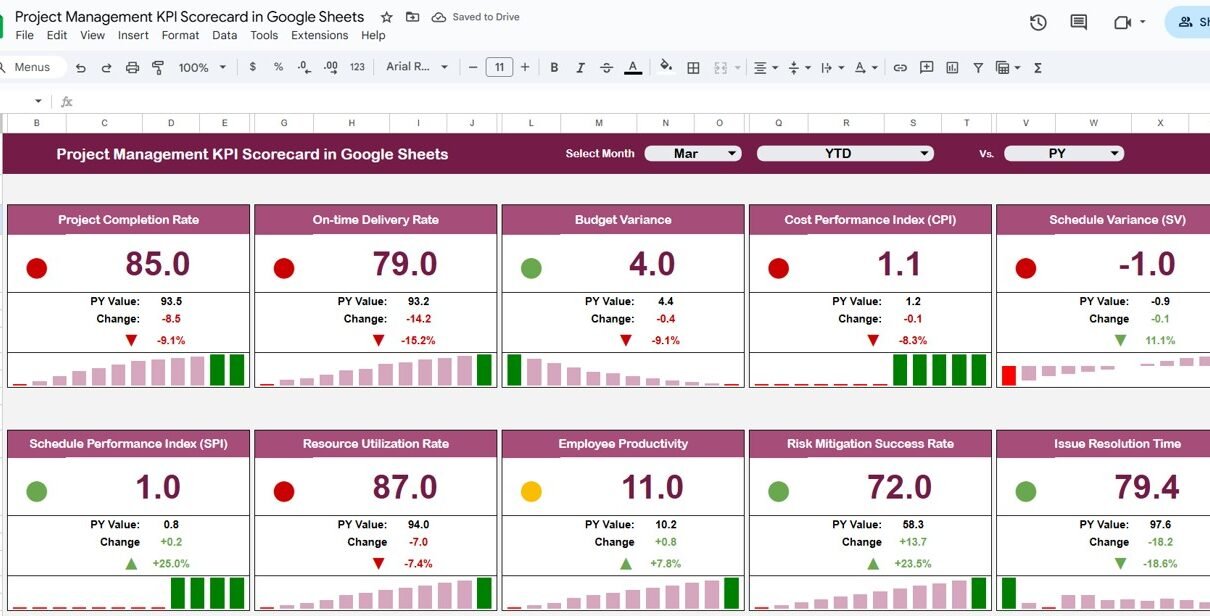
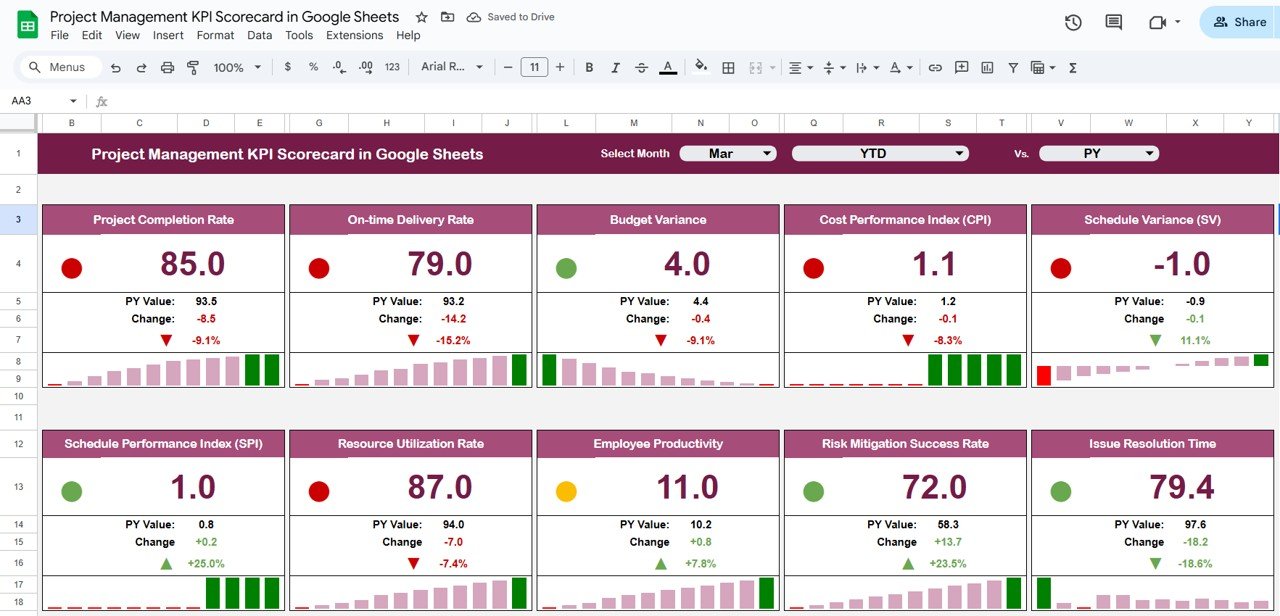
1. Dashboard Sheet Tab
This is the main interactive dashboard where performance is visualized.
Key Features:
-
Month Selector (Top Dropdown): Choose a month from the dropdown (range D3). When you select a month, all KPIs update automatically.
-
10 Core KPIs: The dashboard displays metrics such as cost variance, on-time completion, project satisfaction, and more.
-
Traffic Light Indicators: Red, yellow, and green lights show KPI status against targets.
-
Up/Down Arrows: Indicate improvement or decline compared to previous periods.
MTD/YTD Toggle:
- Click MTD to view current month data
- Click YTD to view cumulative annual data
This setup helps you evaluate project health in both short-term and long-term views.
Click to Buy Project Management KPI Scorecard in Google Sheets
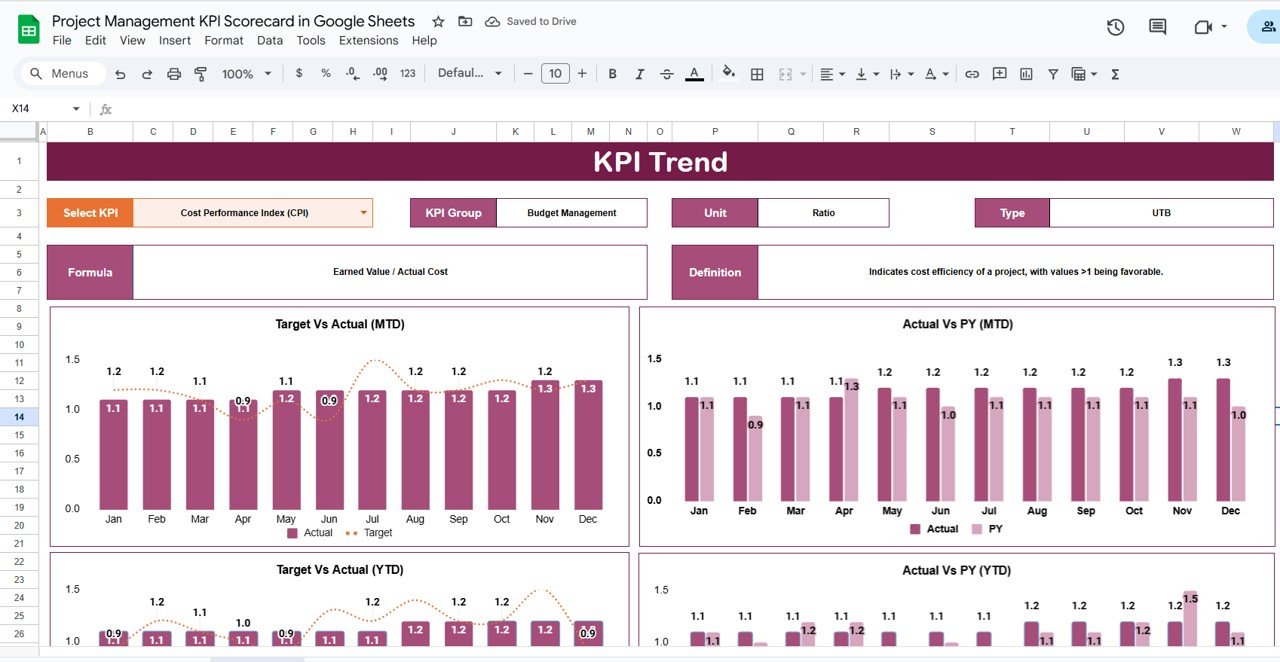
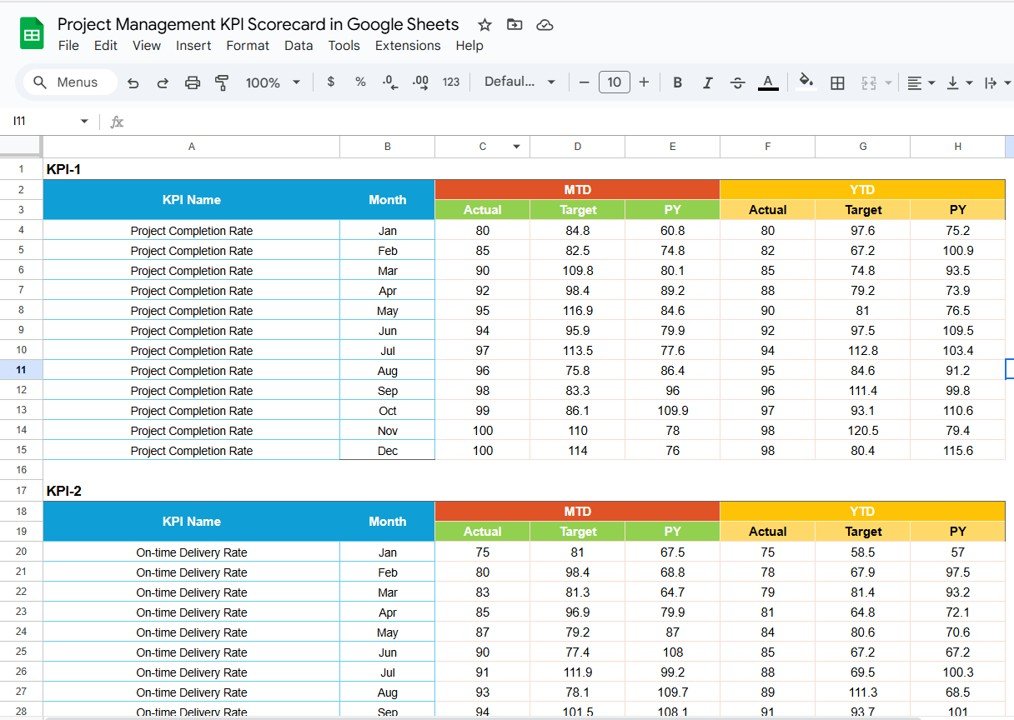
2. KPI Trend Sheet Tab
The KPI Trend Sheet provides historical trend analysis.
Features:
-
Select a KPI from the dropdown (range C3) to view its data trends
-
Displays KPI Group, Unit, Type (Lower-the-Better or Upper-the-Better), Formula, and Definition
-
Includes trend charts to visualize month-over-month performance
This tab helps identify long-term performance patterns and improvement opportunities.
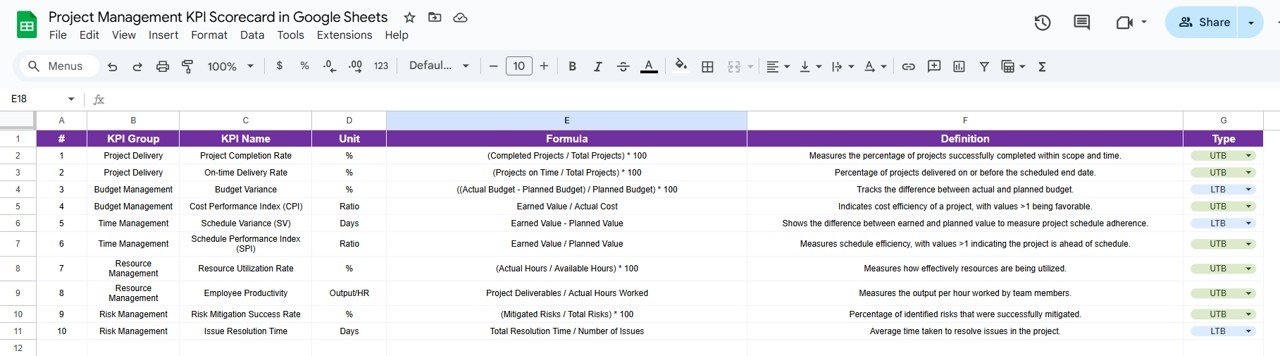
3. KPI Definition Sheet Tab
This sheet serves as the reference guide for all KPIs.
Columns Include:
-
KPI Name
-
KPI Group
-
Unit (e.g., %, $, count)
-
Formula (used for calculation)
-
Definition (brief explanation of the KPI)
-
Type (UTB – Upper the Better or LTB – Lower the Better)
Defining KPIs ensures data consistency and standardization across all reports.
Click to Buy Project Management KPI Scorecard in Google Sheets
4. Data Input Sheet Tab
The Data Input Sheet is where you enter the raw project data.
Features:
-
Columns for each KPI with monthly entries
-
Data automatically flows into the dashboard through formulas
-
Built to handle multiple projects, teams, or time periods
This sheet forms the foundation of the dashboard, ensuring accuracy and transparency.
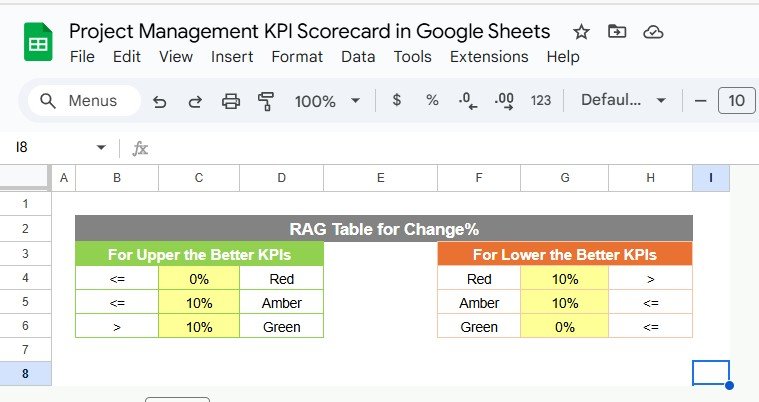
5. Color Settings Sheet Tab
This optional tab controls the conditional formatting settings used across the dashboard.
Adjustments Include:
-
Thresholds for red, yellow, and green lights
-
Icons for up/down trend arrows
-
Customizable color codes for branding or visibility
It allows users to tailor the visual representation of performance data.
Click to Buy Project Management KPI Scorecard in Google Sheets
Advantages of Using the Project Management KPI Scorecard
-
Centralized Performance Monitoring: All KPIs in one sheet
-
Real-Time Insights: Auto-calculations update instantly when data changes
-
Data Visualization: Traffic lights and trend arrows make it easy to interpret results
-
Flexibility: Adaptable for multiple projects or departments
-
Ease of Use: Google Sheets enables team collaboration and online sharing
-
Consistency: KPI definitions and formulas standardized across periods
Best Practices for Using the KPI Scorecard
-
Define Clear KPIs: Align metrics with strategic project goals.
-
Update Data Monthly: Keep actual numbers current for accurate reporting.
-
Monitor Trends: Use the KPI Trend tab to identify recurring issues.
-
Focus on Outliers: Pay attention to red indicators to prioritize action.
-
Review Thresholds Regularly: Adjust color coding as your performance benchmarks evolve.
How This KPI Scorecard Helps Project Managers
Click to Buy Project Management KPI Scorecard in Google Sheets
-
Improves Decision-Making: Provides actionable insights from data.
-
Enhances Accountability: Tracks KPIs by project, team, or department.
-
Increases Efficiency: Quickly spot underperforming areas.
-
Facilitates Reporting: Generates visual scorecards for leadership reviews.
-
Supports Strategic Alignment: Keeps teams focused on key objectives.
Frequently Asked Questions (FAQs)
Click to Buy Project Management KPI Scorecard in Google Sheets
Q1: Can I customize the KPIs in this scorecard?
Yes, you can easily add or remove KPIs based on your project’s needs.
Q2: How often should I update the data?
It’s best to update monthly for MTD and YTD accuracy.
Q3: Can I track multiple projects simultaneously?
Yes, you can add columns or duplicate tabs for different projects.
Q4: What do UTB and LTB mean?
UTB (Upper the Better) means higher values indicate better performance, while LTB (Lower the Better) means lower values are desirable.
Q5: Can I visualize trends for all KPIs?
Yes, use the KPI Trend tab to view month-over-month and yearly trends.
Conclusion
Click to Buy Project Management KPI Scorecard in Google Sheets
The Project Management KPI Scorecard in Google Sheets provides an intuitive, interactive, and visual way to track project success. With automated indicators, trend charts, and standardized KPI definitions, it empowers managers to make smarter decisions, enhance productivity, and achieve project goals efficiently.
Visit our YouTube channel to learn step-by-step video tutorials
Youtube.com/@NeotechNavigators
Watch the step-by-step video Demo:
Click to Buy Project Management KPI Scorecard in Google Sheets