Public health organizations play a critical role in ensuring the well-being of populations. To achieve this, they need effective tools to track performance, monitor progress, and identify areas for improvement. One such tool is a Public Health KPI (Key Performance Indicator) Dashboard in Google Sheets, a ready-to-use template that enables organizations to keep a pulse on public health initiatives, monitor essential health metrics, and drive better decision-making.
In this article, we will explore the Public Health KPI Dashboard in Google Sheets—its key features, the KPIs it tracks, and best practices for using it to enhance your public health programs. We will also cover the advantages of using this template, opportunities for improvement, and answer some frequently asked questions.
Key Features of the Public Health KPI Dashboard in Google Sheets
A Public Health KPI Dashboard helps organizations measure the effectiveness of public health programs by tracking various key metrics. The Google Sheets version of this dashboard offers several key features that make it easy for health organizations to manage their data effectively.
1. Dashboard Sheet Tab
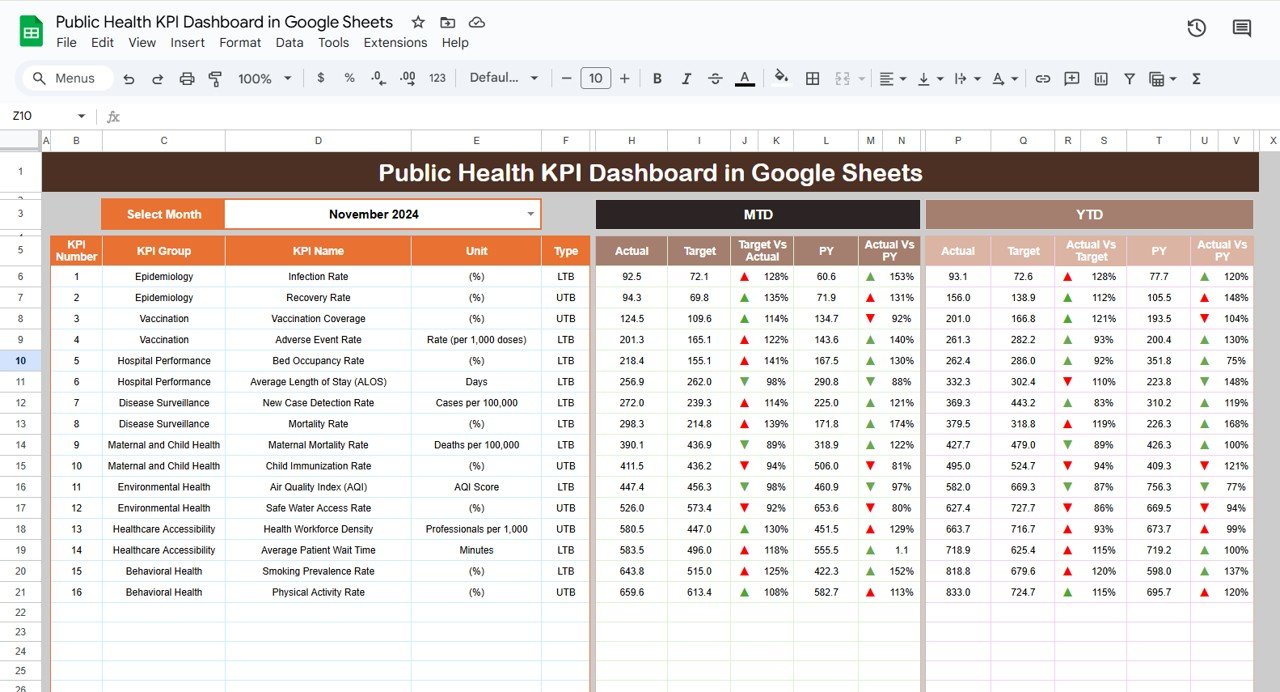
This sheet serves as the main interface for the KPI Dashboard. It provides an overview of all the KPIs being tracked and their associated performance metrics.
-
Key Metrics: The dashboard displays Monthly-to-Date (MTD) and Year-to-Date (YTD) actual performance alongside target figures.
-
Interactive Functionality: Users can select a specific month from the dropdown (range D3), which automatically updates all data on the dashboard.
-
Conditional Formatting: The dashboard utilizes up and down arrows with conditional formatting to highlight variances between the target and actual values, as well as comparisons with previous years.
Click to buy Public Health KPI Dashboard in Google Sheets
2. KPI Trend Sheet Tab
The KPI Trend Sheet allows users to track the progress of individual KPIs over time. Here’s how it works:
KPI Selection: Users can select a specific KPI name from the dropdown (range C3).
Details Provided: For each selected KPI, the sheet displays:
- KPI Group
- Unit of Measurement
- Type (Lower the Better or Upper the Better)
- Formula for aggregation
- Definition of the KPI

Click to buy Public Health KPI Dashboard in Google Sheets
3. Actual Numbers Sheet Tab
In this sheet, users input the actual numbers for each KPI, categorized by YTD and MTD figures.
-
Data Entry: Enter the first month of the year in range E1 to update the sheet for that month.
-
Customizable: Users can change the month to view data for different periods.

4. Target Sheet Tab
This sheet allows users to enter target values for each KPI on both a monthly (MTD) and year-to-date (YTD) basis.
-
Flexible Input: The targets for each KPI can be adjusted as necessary to align with evolving health goals.

Click to buy Public Health KPI Dashboard in Google Sheets
5. Previous Year Numbers Sheet Tab
Here, users enter the previous year’s data to compare current performance against historical figures.
-
Data Comparison: This comparison helps organizations understand trends and assess the effectiveness of public health initiatives over time.

6. KPI Definition Sheet Tab
This sheet serves as a reference guide for all the KPIs in the dashboard, listing their name, group, unit of measurement, formula, and a brief definition.
-
Clear Definitions: This sheet ensures that all stakeholders understand each KPI’s purpose and how the data is being calculated.

Click to buy Public Health KPI Dashboard in Google Sheets
Advantages of Using a Public Health KPI Dashboard in Google Sheets
The Public Health KPI Dashboard in Google Sheets offers several key advantages for public health organizations. By centralizing data and streamlining the tracking of important metrics, this tool enables organizations to make more informed decisions and improve program outcomes.
- Centralized Data Management: By having all your health data in one place, the dashboard simplifies data entry and monitoring. Organizations no longer need to manage multiple documents or spreadsheets—everything can be accessed from a single location.
- Customizable and User-Friendly: The Google Sheets template is easy to customize, allowing organizations to tailor the dashboard to their specific KPIs. Whether tracking vaccination rates, disease prevalence, or healthcare access, the dashboard can be adjusted to fit the unique needs of your public health initiatives.
- Real-Time Monitoring: With the ability to select different months and track both MTD and YTD performance, the dashboard offers real-time insights into the effectiveness of health programs. Decision-makers can quickly identify trends, monitor progress, and act accordingly.
- Enhanced Collaboration; Since Google Sheets is a cloud-based tool, multiple team members can access and update the dashboard simultaneously. This facilitates collaboration across departments and ensures that everyone has access to the latest data.
- Data Visualization: With conditional formatting, up/down arrows, and other visual cues, the dashboard makes it easy to interpret complex data. This visual approach helps stakeholders quickly grasp the state of various health initiatives and make decisions faster.
Opportunities for Improvement in Public Health KPI Dashboard
Click to buy Public Health KPI Dashboard in Google Sheets
While the Public Health KPI Dashboard in Google Sheets is a powerful tool, there are always opportunities for improvement. Here are a few areas where the dashboard can evolve:
- Automation of Data Entry: Currently, data entry for actual and target figures requires manual input. Automating this process by integrating the dashboard with other data sources (such as health information systems) can save time and reduce the risk of human error.
- Advanced Data Analysis: Incorporating more advanced data analysis features, such as trend lines or predictive analytics, could provide a deeper understanding of public health trends and forecasts. This would help organizations anticipate future challenges and adjust their programs accordingly.
- Interactive Dashboards: To make the dashboard even more dynamic, consider adding interactive elements such as slicers, drop-down menus, and drill-down options for more granular data analysis. This would allow users to explore the data from different perspectives.
- Cross-Department Collaboration; Currently, the dashboard is primarily used for tracking public health KPIs. Expanding it to include other departments—such as human resources, finance, and operations—would allow for cross-functional collaboration and more comprehensive performance tracking.
Best Practices for Using a Public Health KPI Dashboard in Google Sheets
Click to buy Public Health KPI Dashboard in Google Sheets
To get the most out of your Public Health KPI Dashboard, consider implementing these best practices:
- Regularly Update Data: Ensure that data is entered regularly and consistently to maintain the accuracy of the dashboard. This will help you track progress in real-time and make timely adjustments to your public health programs.
- Set Clear Targets: Before using the dashboard, make sure you set clear and realistic targets for each KPI. These targets should be aligned with your overall public health goals and updated as needed to reflect changes in priorities.
- Monitor Key Trends: Use the dashboard to identify trends over time. Pay close attention to any KPIs that are consistently underperforming and investigate the underlying causes. This proactive approach will help you address issues before they become significant problems.
- Collaborate with Stakeholders: Encourage team members and stakeholders to regularly review the dashboard together. Discussing the data and its implications can lead to better decision-making and more effective public health initiatives.
- Continuously Improve the Dashboard: As your public health goals evolve, so should your dashboard. Regularly review and improve the dashboard’s structure, data sources, and KPIs to ensure it remains relevant and effective.
Frequently Asked Questions (FAQs)
What are KPIs in public health?
KPIs in public health are metrics used to measure the performance and effectiveness of health programs. These indicators can track various aspects of public health, such as disease prevalence, healthcare access, vaccination rates, and mortality rates.
How do I set targets for public health KPIs?
To set targets for public health KPIs, align them with your health organization’s goals. Targets should be measurable, realistic, and based on historical data or health benchmarks. Regularly review and update them as necessary to reflect changes in public health priorities.
Can I integrate the Public Health KPI Dashboard with other systems?
Yes, the Public Health KPI Dashboard can be integrated with other health information systems or data sources to automate data entry and reduce manual input. This can improve the efficiency and accuracy of the dashboard.
Is the Public Health KPI Dashboard customizable?
Absolutely! The Public Health KPI Dashboard is fully customizable. You can adjust the KPIs, targets, and data sources to suit your organization’s specific needs.
How can I track the progress of health programs using this dashboard?
By entering actual performance data into the dashboard, you can compare it against targets and previous years’ data to track progress. The dashboard also uses visual cues like conditional formatting and up/down arrows to highlight areas of success and improvement.
Conclusion
The Public Health KPI Dashboard in Google Sheets is a valuable tool for organizations looking to track and improve the performance of their public health programs. With its user-friendly design, real-time monitoring, and customizable features, it enables stakeholders to make informed decisions that can significantly impact public health outcomes.
Visit our YouTube channel to learn step-by-step video tutorials
Youtube.com/@NeotechNavigators
Watch the step-by-step video Demo: