Tracking the effectiveness of your public relations (PR) campaigns is crucial to achieving brand visibility and improving stakeholder relationships. The Public Relations KPI Dashboard in Google Sheets is a ready-to-use template that helps you track key performance indicators (KPIs) related to your PR efforts. This dashboard provides a clear overview of your PR campaigns and allows you to monitor your performance on a monthly, quarterly, or annual basis.
In this article, we’ll walk you through the key features of the Public Relations KPI Dashboard and explain how it can help you stay on top of your PR goals.
What is the Public Relations KPI Dashboard in Google Sheets?
The Public Relations KPI Dashboard is a tool designed to help PR professionals track and evaluate the effectiveness of their campaigns. This dashboard is structured to provide a detailed overview of various PR KPIs, such as media coverage, sentiment analysis, reach, and more. By organizing this data into a visual, easy-to-understand format, the dashboard allows you to make data-driven decisions and optimize future campaigns.
The dashboard is built in Google Sheets and comes with six worksheets to help you monitor and evaluate your PR activities.
Key Features of the Public Relations KPI Dashboard
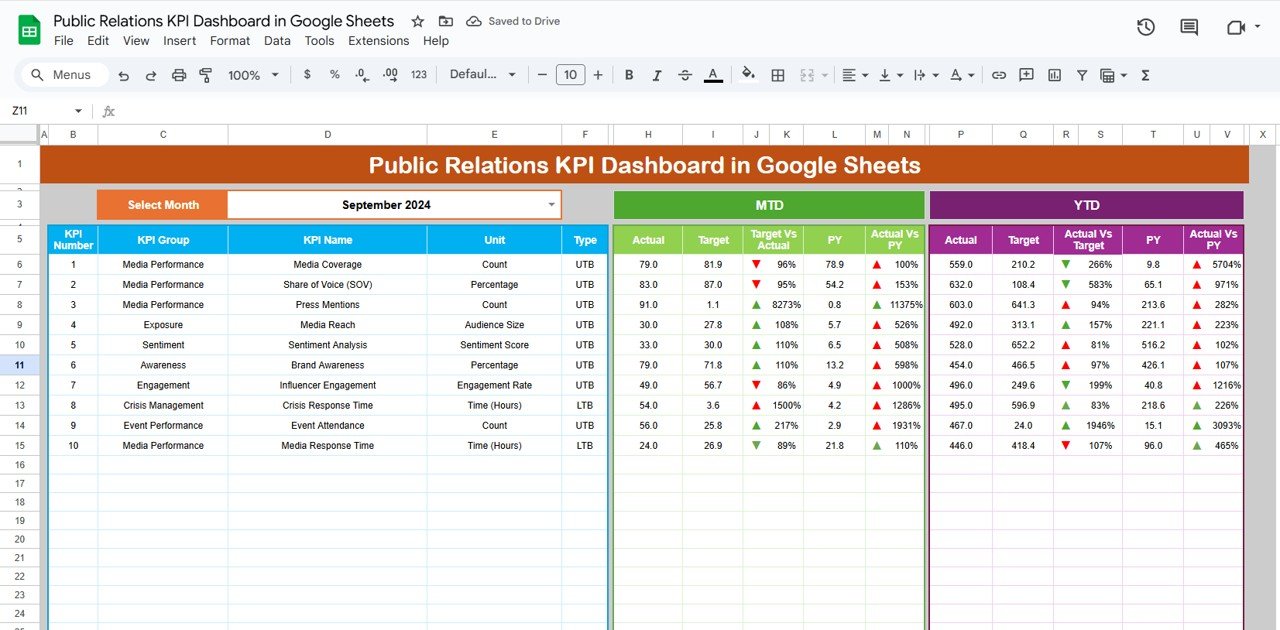
1. Dashboard Sheet Tab
The Dashboard Sheet Tab is the main sheet that summarizes all the KPIs in a single view. It includes:
-
MTD Actual: Displays the current month’s actual numbers.
-
Target: Shows the target for each KPI.
-
Previous Year Data (PY): Compares current data with the previous year’s data.
-
Target vs. Actual: A visual comparison between the target and the actual performance, with conditional formatting indicating whether the goal has been met.
-
YTD Actual: Year-to-date actual performance data.
-
PY vs. Actual (YTD): A year-over-year comparison of YTD data.
This sheet allows you to select the month from a dropdown in Range D3, and the entire dashboard will automatically update for the selected month.
Click to buy Public Relations KPI Dashboard in Google Sheets
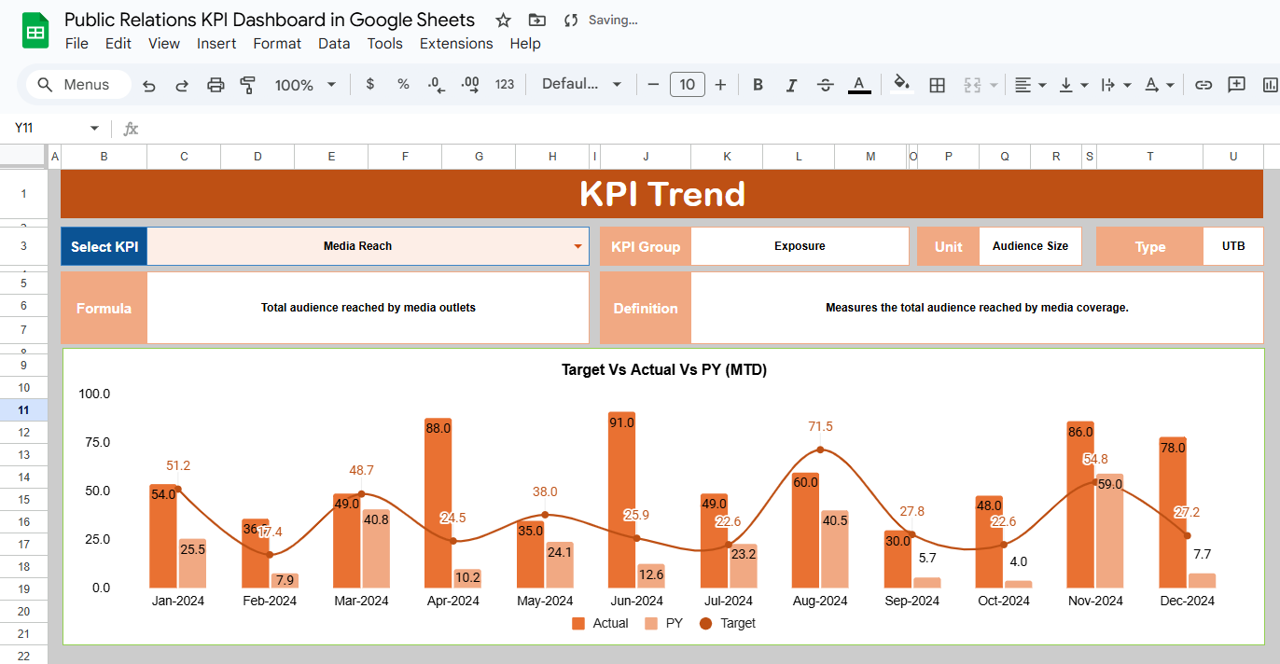
2. KPI Trend Sheet Tab
In the KPI Trend Sheet Tab, you can:
-
Select the KPI Name: Choose a specific KPI from a dropdown available in Range C3.
-
View KPI Group, Unit, Type: The sheet displays important details about each KPI, such as the KPI group, unit of measurement, and whether the KPI is “Lower the Better” or “Upper the Better”.
-
KPI Formula and Definition: You can view the formula used to calculate each KPI and its definition, making it easier to understand how the data is aggregated.
Click to buy Public Relations KPI Dashboard in Google Sheets
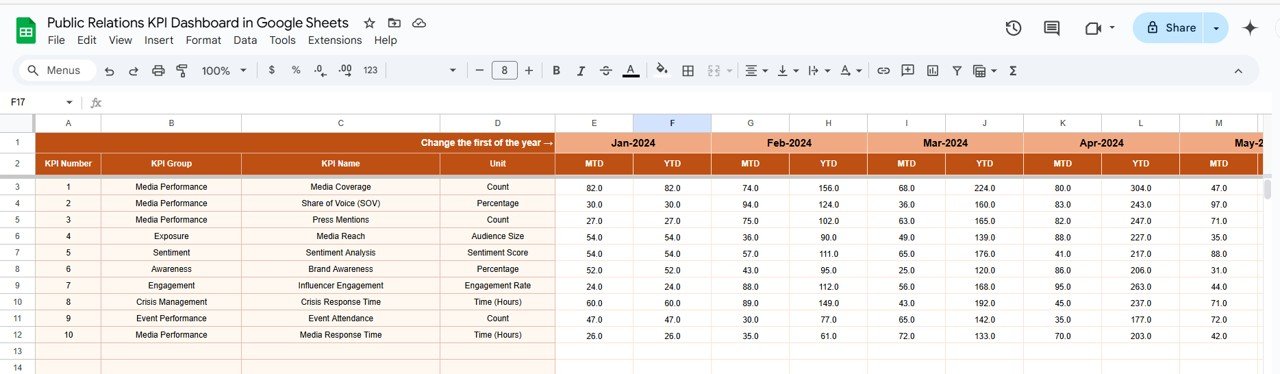
3. Actual Numbers Sheet Tab
In the Actual Numbers Sheet Tab, you input the actual values for both MTD and YTD (Year-To-Date). This is where you enter data on an ongoing basis to keep the dashboard updated.
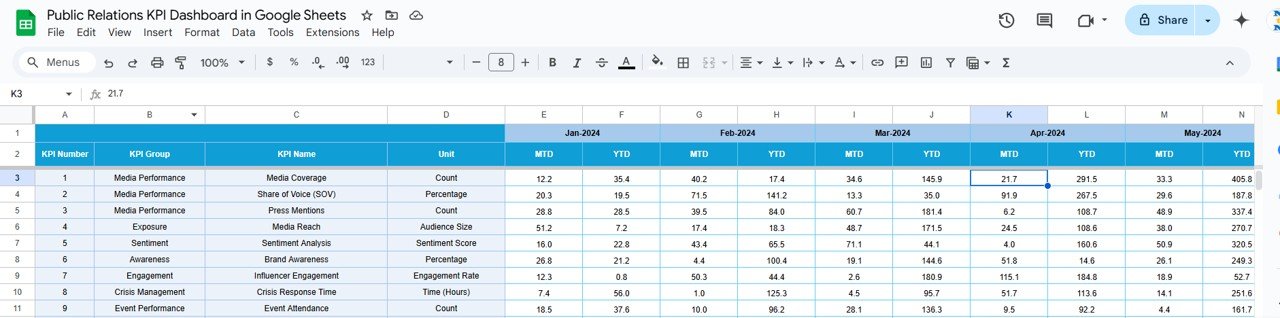
4. Target Sheet Tab
This tab is used to input the target values for each KPI, both for MTD and YTD. This allows you to set performance goals for each metric and compare them to actual performance.
Click to buy Public Relations KPI Dashboard in Google Sheets
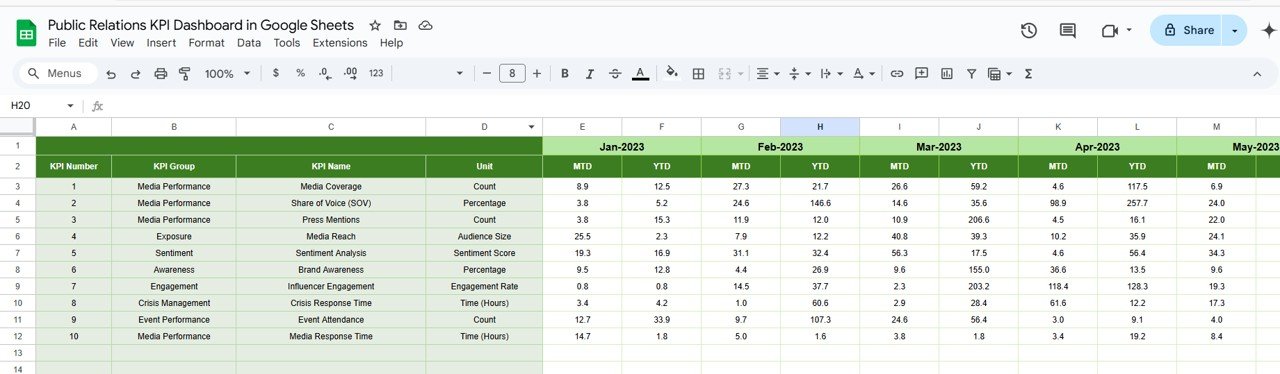
5. Previous Year Numbers Sheet Tab
In this sheet, you enter the data for the previous year, which will be compared to the current year’s data. This historical comparison helps you understand your performance trends over time.
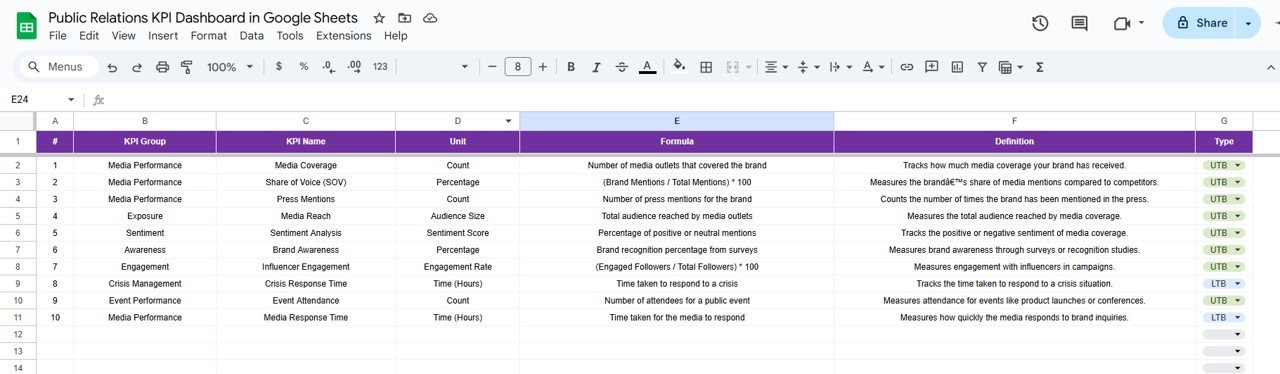
6. KPI Definition Sheet Tab
This tab holds the definitions for each KPI used in the dashboard. It includes the KPI name, KPI group, unit of measurement, formula, and KPI definition. This is helpful for team members to reference if they need clarification on any metric.
Click to buy Public Relations KPI Dashboard in Google Sheets
Benefits of Using the Public Relations KPI Dashboard
The Public Relations KPI Dashboard offers several key benefits:
-
Centralized Data: All your PR KPIs are available in one place, making it easier to track and analyze your efforts.
-
Visual Comparison: With conditional formatting and comparison charts, you can quickly see how your current performance compares to your targets and previous year.
-
Customizable: Tailor the dashboard to your specific needs by adjusting the KPIs, targets, and data inputs.
-
Data-Driven Decisions: Use the insights from the dashboard to make informed decisions about your PR campaigns, adjusting strategies as needed.
-
Real-Time Updates: The dashboard updates in real time, ensuring that your data is always current and relevant.
-
Easy Sharing: Since the dashboard is built in Google Sheets, sharing it with team members, managers, or stakeholders is simple.
How to Use the Public Relations KPI Dashboard
Click to buy Public Relations KPI Dashboard in Google Sheets
Using the Public Relations KPI Dashboard is simple:
-
Input Data: Enter your MTD, YTD, Target, and Previous Year data into the respective sheets.
-
Track Progress: Use the Dashboard Sheet to see an overview of how you’re tracking against your KPIs, with visual comparisons to your targets.
-
Update Regularly: Regularly input actual performance data into the Actual Numbers sheet and adjust targets as needed to keep the dashboard accurate.
-
Analyze Trends: Use the KPI Trend Sheet to see how specific KPIs are performing over time and make adjustments to your strategies accordingly.
Conclusion
The Public Relations KPI Dashboard in Google Sheets is a powerful tool that simplifies the management and tracking of PR campaigns. With real-time data input, visual comparisons, and easy tracking of key metrics, this dashboard helps PR teams optimize their efforts and drive results. By using this template, you can stay on top of your campaigns, ensure alignment with your goals, and make data-driven decisions that lead to success.
Frequently Asked Questions (FAQs)
Click to buy Public Relations KPI Dashboard in Google Sheets
1. Can I customize the KPIs in the dashboard?
Yes, the Public Relations KPI Dashboard is fully customizable. You can add or remove KPIs based on your specific needs.
2. How do I update the data?
Simply enter the MTD and YTD data into the respective sheets. The dashboard will automatically update with the latest information.
3. Can I use this dashboard for multiple PR campaigns?
Yes, the dashboard can be easily adapted to track multiple campaigns by adding new data rows and adjusting KPIs accordingly.
4. How do I share the dashboard with my team?
You can share the Google Sheets dashboard with your team by providing them with access through Google Drive.
5. Can I track multiple years of data?
Yes, you can track data over multiple years by updating the Previous Year Numbers sheet and comparing current data with historical performance.
Visit our YouTube channel to learn step-by-step video tutorials
Youtube.com/@NeotechNavigators
Watch the step-by-step video Demo:
Click to buy Public Relations KPI Dashboard in Google Sheets