In today’s fast-paced world, data-driven decision-making is crucial, especially in the public sector. Public Sector organizations face unique challenges such as transparency, accountability, and efficiency. One powerful tool that can help address these challenges is a Key Performance Indicator (KPI) dashboard. A Public Sector KPI Dashboard in Google Sheets allows government agencies and public sector organizations to track their performance in various areas, analyze trends, and make informed decisions.
In this article, we will provide an in-depth look at how to set up a Public Sector KPI Dashboard in Google Sheets. We will discuss the key features, advantages, opportunities for improvement, and best practices for using this tool effectively. We will also answer frequently asked questions about creating and managing KPI dashboards for the public sector.
What is a Public Sector KPI Dashboard?
A Public Sector KPI Dashboard is a data visualization tool used by public sector organizations to track, measure, and report on key metrics related to their performance. KPIs (Key Performance Indicators) help monitor the effectiveness of operations and initiatives and ensure that organizations are meeting their strategic goals. These KPIs can include anything from budget adherence to service delivery performance, employee satisfaction, or project completion rates.
The dashboard aggregates and visualizes data from multiple sources into an easily digestible format, allowing decision-makers to gain insights at a glance. By using Google Sheets, these dashboards become accessible, shareable, and collaborative, making it an ideal tool for public sector organizations.
Key Features of a Public Sector KPI Dashboard in Google Sheets
Click to buy Public Sector KPI Dashboard in Google Sheets
A Public Sector KPI Dashboard in Google Sheets typically consists of several worksheets that handle different aspects of performance tracking. Here are the key features of the dashboard:
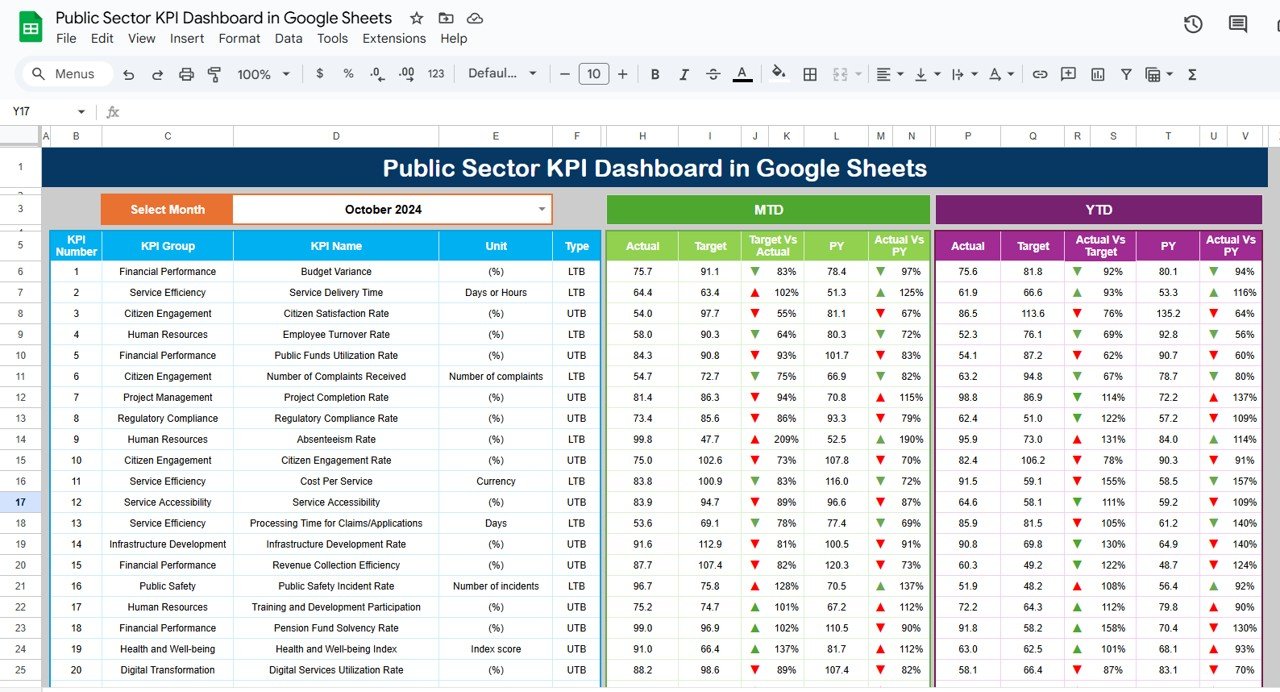
1. Dashboard Sheet Tab
This is the main sheet where all the information about the KPIs is displayed.
Users can select the desired month from a drop-down in Range D3, and the dashboard will automatically update the numbers for that month.
The dashboard includes:
- MTD (Month to Date): Actual numbers, targets, and previous year data with conditional formatting to show trends (upward or downward arrows).
- YTD (Year to Date): Actual numbers, targets, and previous year data with similar conditional formatting for comparison.

Click to buy Public Sector KPI Dashboard in Google Sheets
2. KPI Trend Sheet Tab
Here, users can select a KPI from the drop-down menu in Range C3.
The sheet provides detailed information on:
KPI Group
- Unit of KPI
- KPI Type: Whether it’s “Lower the Better” (LTB) or “Upper the Better” (UTB).
- Formula for calculating the KPI.
- Definition of the KPI.

Click to buy Public Sector KPI Dashboard in Google Sheets
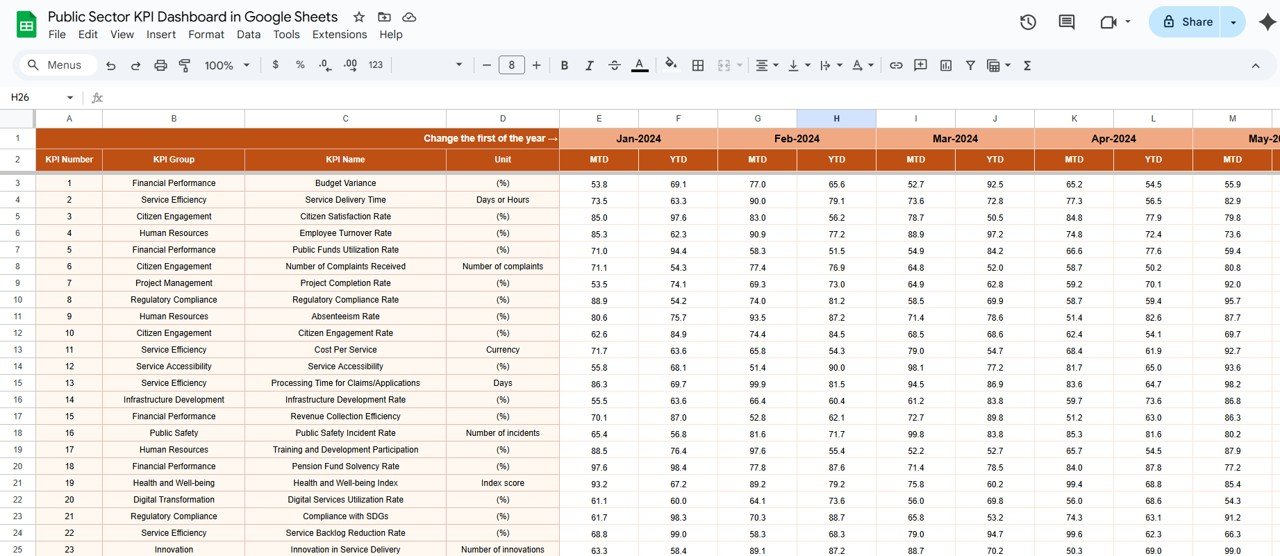
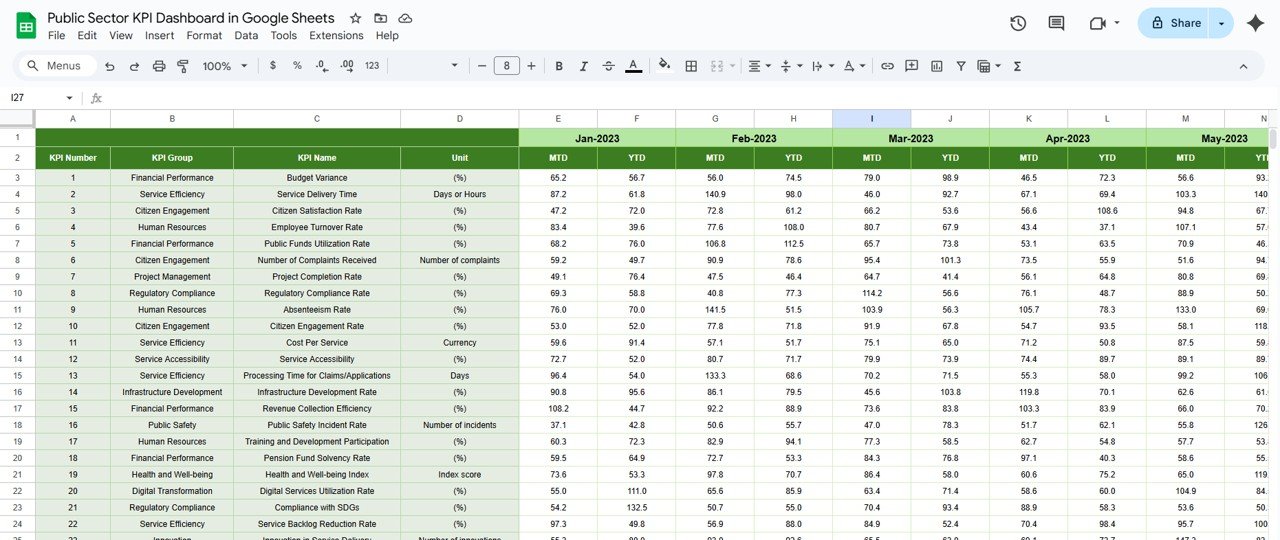
3. Actual Number Sheet Tab
This is where users enter actual numbers for MTD and YTD for each KPI.
Users can update the month by changing Range E1.
4. Target Sheet Tab
In this tab, users enter the target values for each KPI, both for MTD and YTD.
This allows organizations to track performance against predefined goals.

Click to buy Public Sector KPI Dashboard in Google Sheets
5. Previous Year Number Sheet Tab
This tab contains the actual numbers from the previous year, which are entered for comparison with the current year’s data.
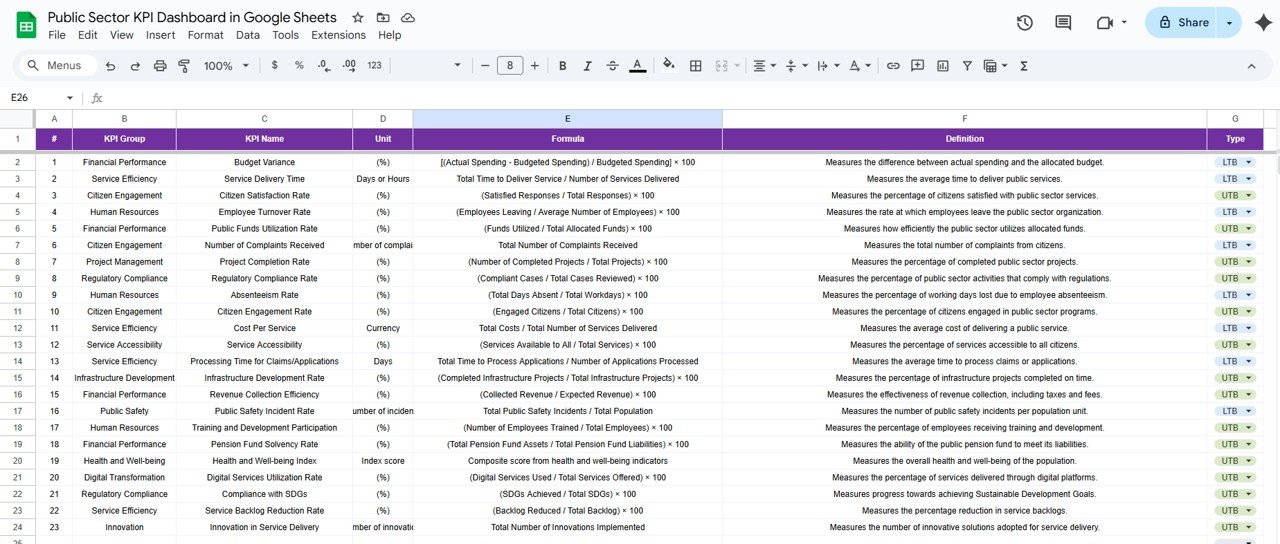
6. KPI Definition Sheet Tab
Here, users can manage and update the definitions of each KPI, including the name, group, unit of measure, formula, and overall definition.
Advantages of Using a Public Sector KPI Dashboard in Google Sheets
- Cost-Effective and Easy to Use: Google Sheets is free to use, making it an affordable solution for public sector organizations. Moreover, it’s a platform that most employees are already familiar with, which reduces the learning curve.
- Real-Time Data Sharing and Collaboration: Google Sheets allows multiple users to access and edit the dashboard simultaneously, enabling real-time collaboration. This feature is crucial for teams that need to make quick decisions based on the latest data.
- Cloud-Based and Accessible Anywhere: Being cloud-based, Google Sheets provides easy access from anywhere, making it an ideal solution for public sector organizations that may have staff in different locations or need to share data with external stakeholders.
- Automated Data Updates: By integrating data from different sources into Google Sheets, users can automate the process of updating their KPIs. This reduces manual work and ensures that the data is always up-to-date.
- Data Transparency: The dashboard provides clear and transparent insights into public sector performance. This is vital for ensuring accountability and demonstrating the impact of public initiatives to stakeholders and citizens.
Opportunities for Improvement in Public Sector KPI Dashboards
Click to buy Public Sector KPI Dashboard in Google Sheets
- Enhancing Data Accuracy: One key area for improvement is ensuring that the data entered in Google Sheets is accurate. Public sector organizations should have strict data validation rules and processes in place to minimize human error.
- Automating Data Import: While Google Sheets allows manual data entry, automating the data import process from other systems (e.g., databases or APIs) could improve efficiency and reduce errors.
- Integrating More Advanced Analytics: While Google Sheets offers basic analytics tools, there is an opportunity to integrate more advanced analytics and forecasting features, such as trend analysis, predictive modeling, and anomaly detection.
- Customizing Dashboards for Different Departments: Public sector organizations often have multiple departments with different performance metrics. Improving the customization of dashboards for different teams or departments could make the dashboard more relevant and useful.
Best Practices for Using a Public Sector KPI Dashboard
- Define Clear KPIs: Before setting up a dashboard, ensure that KPIs are clearly defined, relevant to the organization’s goals, and measurable. Ambiguous or poorly defined KPIs can lead to confusion and misinterpretation of data.
- Use Visuals Effectively: Utilize visuals such as charts, graphs, and color-coded indicators to make the data more comprehensible. This helps users quickly identify trends, whether positive or negative.
- Update the Dashboard Regularly: Set a routine to regularly update the dashboard with the latest data. This ensures that the dashboard reflects the current status and provides accurate insights for decision-making.
- Provide Training: Ensure that staff members understand how to use the dashboard and interpret the data. Providing training on how to enter data correctly and use the dashboard for decision-making is essential for success.
- Secure Sensitive Data: Protect sensitive data within the dashboard by setting up appropriate user access controls and permissions. Public sector data often contains sensitive information that must be safeguarded.
- Monitor Performance Continuously: Don’t just rely on the dashboard for occasional reports. Use it as a tool for continuous performance monitoring and improvement. Regularly review the dashboard to identify areas for operational optimization.
Frequently Asked Questions About Public Sector KPI Dashboards
Click to buy Public Sector KPI Dashboard in Google Sheets
What are KPIs in the Public Sector?
KPIs (Key Performance Indicators) in the public sector are metrics used to measure the performance of government programs, services, or initiatives. They help track whether the public sector is meeting its objectives and fulfilling its mission.
How do I set up a Public Sector KPI Dashboard in Google Sheets?
Setting up a Public Sector KPI Dashboard involves creating different worksheets for tracking KPIs, actual numbers, targets, and previous year data. Each worksheet should be connected with the main dashboard sheet, where all the KPIs will be displayed in a visual format.
Can I automate data entry in a Google Sheets KPI dashboard?
Yes, you can automate data entry by using Google Sheets’ integration capabilities, such as importing data from other Google Sheets, using Google Apps Script, or connecting to external data sources via APIs.
How often should I update the Public Sector KPI Dashboard?
The dashboard should be updated regularly to ensure data accuracy. Depending on your needs, you might update it monthly, quarterly, or whenever there’s a significant change in data.
Is Google Sheets the best tool for a Public Sector KPI Dashboard?
Google Sheets is an excellent tool for small to medium-scale public sector KPI dashboards due to its affordability, accessibility, and ease of use. For more complex dashboards, larger public sector organizations may require more advanced tools like Power BI or Tableau.
Conclusion
A Public Sector KPI Dashboard in Google Sheets is a highly effective tool for monitoring, analyzing, and reporting performance in the public sector. It provides transparency, fosters collaboration, and helps decision-makers track progress toward strategic goals. By defining clear KPIs, adhering to best practices, and improving data accuracy, public sector organizations can leverage these dashboards to make informed decisions and drive continuous improvement.
Visit our YouTube channel to learn step-by-step video tutorials