Push notifications play a critical role in user engagement, retention, and conversions. However, many marketing and product teams struggle to track push notification performance effectively. Data often sits across tools, dashboards remain static, and performance insights become delayed.
That is exactly why a Push Notification KPI Dashboard in Google Sheets becomes an essential solution.
This ready-to-use KPI dashboard helps marketing, product, and growth teams track push notification delivery, open rates, engagement, and performance trends using one centralized and interactive Google Sheets dashboard.
In this article, we explain the dashboard structure, worksheet flow, complete KPI list with formulas, and best practices for push notification performance tracking.
What Is a Push Notification KPI Dashboard in Google Sheets?
Click to Buy Push Notification KPI Dashboard in Google Sheets
A Push Notification KPI Dashboard is a performance tracking tool designed to monitor how push notifications perform across delivery, engagement, and conversion metrics. Instead of checking multiple marketing tools, teams can review all KPIs in one place.
Because this dashboard runs in Google Sheets, it offers:
-
Centralized KPI tracking
-
Real-time collaboration
-
Automatic calculations
-
Target vs actual comparison
-
No need for expensive BI tools
This dashboard suits digital marketers, growth teams, CRM teams, and product managers.
Key Features of the Push Notification KPI Dashboard
The dashboard includes 6 structured worksheet tabs, each designed to support accurate KPI tracking and trend analysis.
Dashboard Sheet Tab (Main Dashboard)
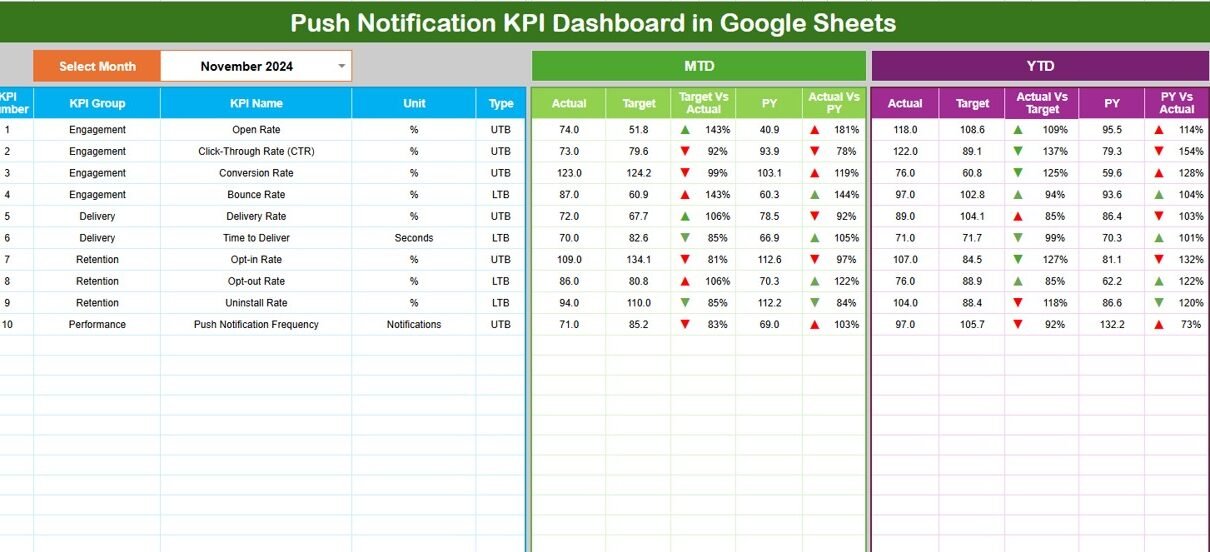
The Dashboard Sheet provides a consolidated view of all push notification KPIs.
-
Select the month from the dropdown in cell D3
-
All KPI values update automatically for the selected month
Metrics Displayed
MTD (Month-to-Date)
-
Actual
-
Target
-
Previous Year
-
Target vs Actual
-
Previous Year vs Actual
YTD (Year-to-Date)
-
Actual
-
Target
-
Previous Year
-
Target vs Actual
-
Previous Year vs Actual
Conditional formatting with up and down arrows clearly highlights performance improvement or decline.

Click to Buy Push Notification KPI Dashboard in Google Sheets
KPI Trend Sheet Tab
The KPI Trend Sheet allows detailed KPI-wise analysis.
-
Select the KPI name from the dropdown in cell C3
The sheet displays:
-
KPI Group
-
Unit of Measurement
-
KPI Type (Lower the Better / Upper the Better)
-
KPI Formula
-
KPI Definition
It also shows month-wise KPI trends for deeper insights.

Click to Buy Push Notification KPI Dashboard in Google Sheets
Actual Number Sheet Tab
This sheet stores actual push notification performance data.
-
Select the first month of the year in cell E1
-
Enter MTD and YTD actual values for each KPI
All dashboard values refresh automatically.

Click to Buy Push Notification KPI Dashboard in Google Sheets
Target Sheet Tab
The Target Sheet stores performance goals for each KPI.
-
Monthly (MTD) targets
-
Annual (YTD) targets
Targets help teams align campaigns with engagement and conversion goals.

Click to Buy Push Notification KPI Dashboard in Google Sheets
Previous Year Number Sheet Tab
This sheet stores previous year KPI values.
It enables:
-
Year-over-year comparison
-
Seasonal trend analysis
-
Performance benchmarking

Click to Buy Push Notification KPI Dashboard in Google Sheets
KPI Definition Sheet Tab
The KPI Definition Sheet acts as a reference layer.
It includes:
-
KPI Name
-
KPI Group
-
Unit
-
Formula
-
KPI Definition
-
KPI Type (UTB / LTB)
This ensures KPI clarity and consistency across teams.

Click to Buy Push Notification KPI Dashboard in Google Sheets
Advantages of Push Notification KPI Dashboard
-
Centralized campaign performance tracking
-
Clear engagement and conversion visibility
-
Target vs actual comparison
-
Historical and YoY analysis
-
Improved campaign optimization
-
Cost-effective Google Sheets solution
Opportunities for Improvement
-
Segment KPIs by campaign type
-
Track personalization impact
-
Analyze time-of-day performance
-
Add platform-wise KPIs (Android/iOS/Web)
-
Automate data import from push tools
Best Practices for Using the Dashboard
Click to Buy Push Notification KPI Dashboard in Google Sheets
-
Update campaign data regularly
-
Set realistic engagement targets
-
Review opt-out trends monthly
-
Optimize timing and frequency
-
Share insights with marketing teams
-
Maintain consistent KPI definitions
Conclusion
Click to Buy Push Notification KPI Dashboard in Google Sheets
A Push Notification KPI Dashboard in Google Sheets provides a structured, visual, and actionable way to measure campaign performance. By combining MTD, YTD, targets, and historical comparisons, teams gain full visibility into engagement and conversion trends. Because the dashboard runs in Google Sheets, it remains flexible, collaborative, and easy to scale.
For marketing teams focused on engagement growth and campaign optimization, this dashboard becomes an essential analytics tool.
Frequently Asked Questions (FAQs)
1. Who should use this dashboard?
Marketing teams, growth teams, and product managers.
2. Can it track multiple campaigns?
Yes, with campaign-level data structure.
3. Is the dashboard customizable?
Yes, all KPIs and targets are editable.
4. Does it support YoY analysis?
Yes, through the Previous Year sheet.
5. Is Google Sheets secure?
Yes, with role-based access controls.
6. Does it require technical skills?
No, basic Google Sheets knowledge is enough.
Visit our YouTube channel to learn step-by-step video tutorials
Youtube.com/@NeotechNavigators
Click to Buy Push Notification KPI Dashboard in Google Sheets