Maintaining consistent quality across business operations is essential for customer satisfaction, compliance, and growth. Monitoring and analyzing the right Key Performance Indicators (KPIs) helps organizations identify improvement areas and maintain high-quality standards. The Quality KPI Scorecard in Google Sheets is a ready-to-use, automated solution designed to track quality performance effectively.
In this article, we’ll explore everything about this interactive scorecard — its structure, features, data flow, advantages, opportunities for improvement, and best practices, followed by a FAQ section for practical clarity.
What Is a Quality KPI Scorecard in Google Sheets?
A Quality KPI Scorecard is a performance monitoring tool built entirely in Google Sheets that helps organizations measure and visualize critical quality-related metrics in real time.
This scorecard captures multiple KPIs — such as defect rates, customer satisfaction, and first-pass yield — to give teams actionable insights into product and service quality. It’s simple, cloud-based, and doesn’t require any coding or external BI software.
Scorecard Sheet Tab Overview
Click to Buy Quality KPI Scorecard in Google Sheets
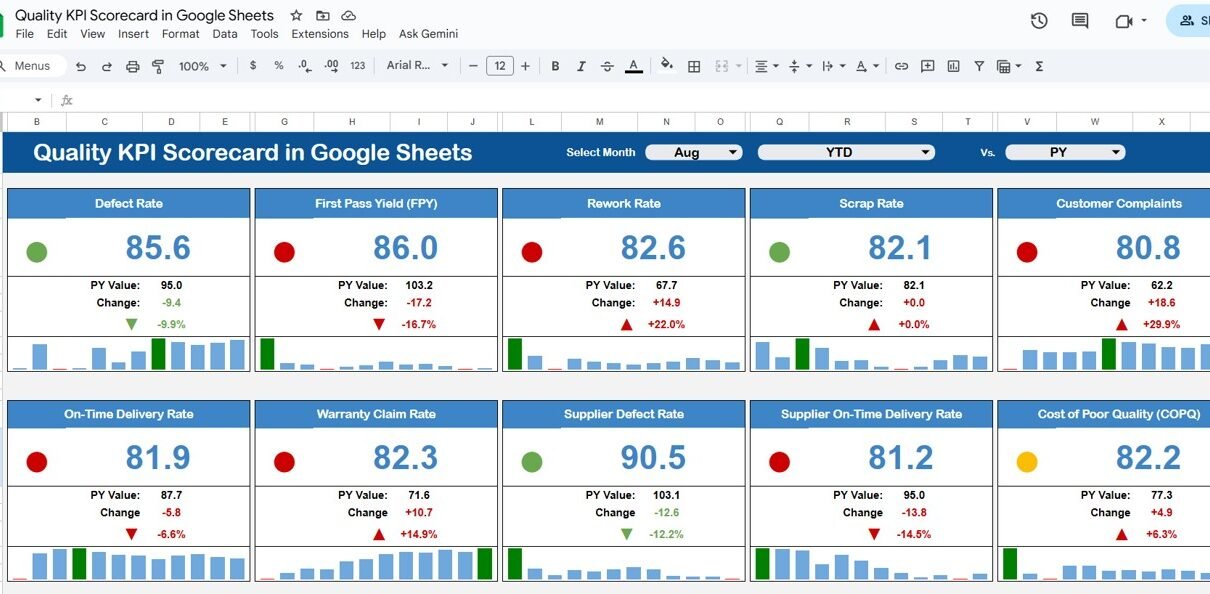
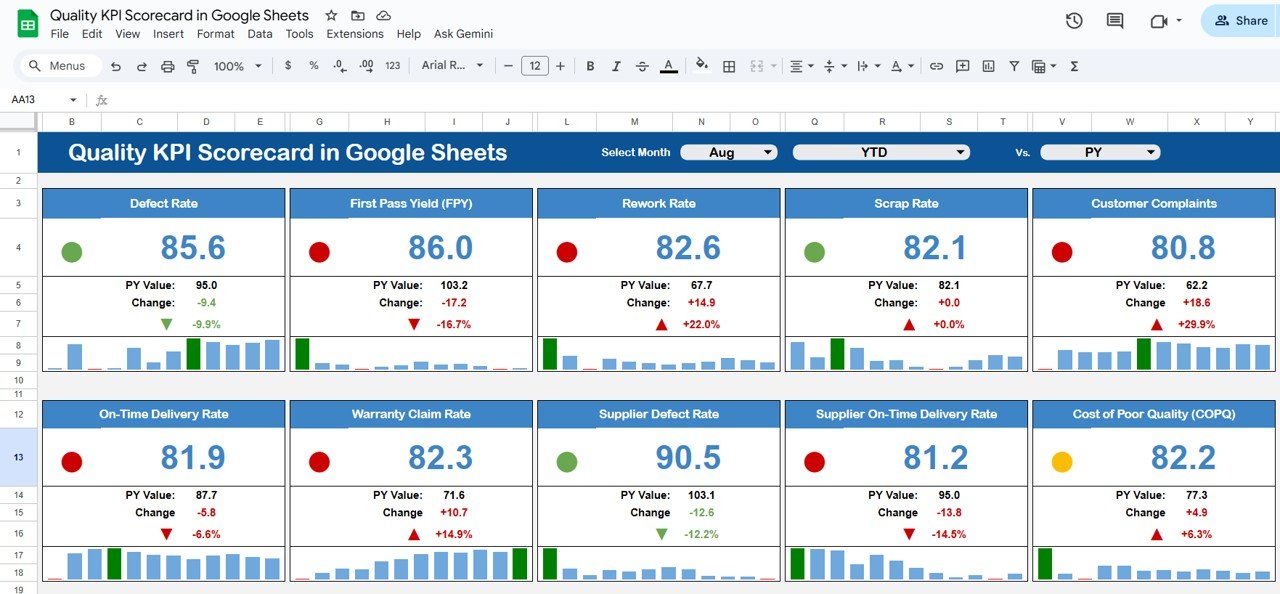
The Scorecard Sheet Tab acts as the main dashboard that displays the performance of all KPIs through visuals, arrows, and traffic light indicators.
Key Features in the Scorecard Sheet
-
Month Dropdown (Cell D3):
Choose any month from the dropdown menu, and all metrics and charts will automatically update to reflect that month’s data. -
MTD/YTD View Toggle:
-
MTD (Month-To-Date): Displays the current month’s performance.
-
YTD (Year-To-Date): Shows the cumulative yearly performance.
-
Automatic Visual Indicators:
- 🟢 Green: Target achieved or exceeded.
- 🟡 Yellow: Slightly below target.
- 🔴 Red: Underperforming KPI.
- ⬆️⬇️ Arrows: Indicate month-over-month improvement or decline with percentage change.
The sheet automatically adjusts these indicators when the user switches between months or views (MTD/YTD)
Click to Buy Quality KPI Scorecard in Google Sheets
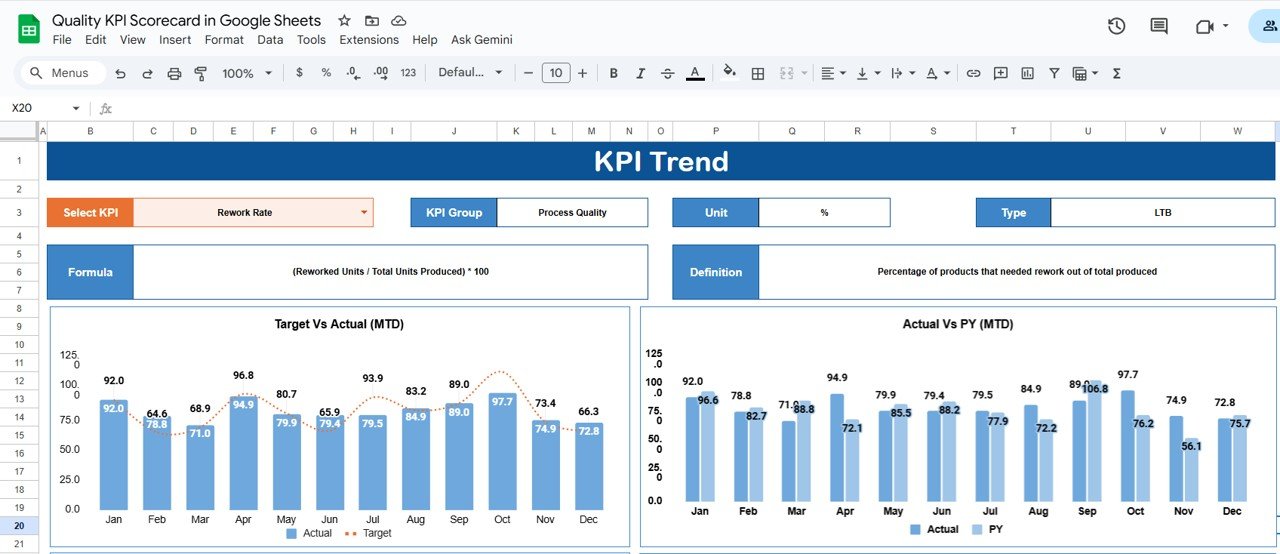
KPI Trend Sheet Tab
The KPI Trend Sheet Tab allows users to view performance trends for individual KPIs over time.
Features:
-
Dropdown (Cell C3): Select any KPI from the list.
Displays:
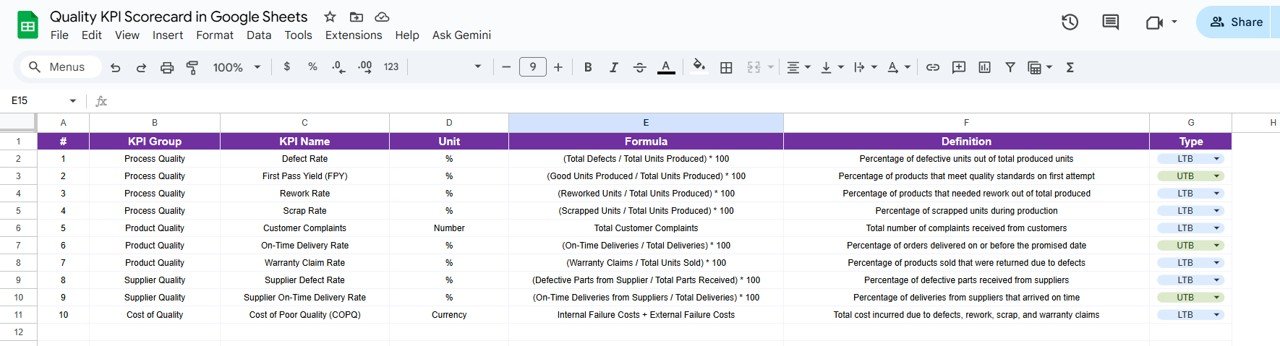
- KPI Group (e.g., Product Quality, Customer Feedback, Production Efficiency)
- Unit (e.g., %, Score, Count)
- Type: UTB (Upper The Better) or LTB (Lower The Better)
- Formula and Definition for each KPI
Visual chart showing KPI trends across months.
This tab helps managers identify long-term performance patterns and pinpoint recurring quality issues.
Click to Buy Quality KPI Scorecard in Google Sheets
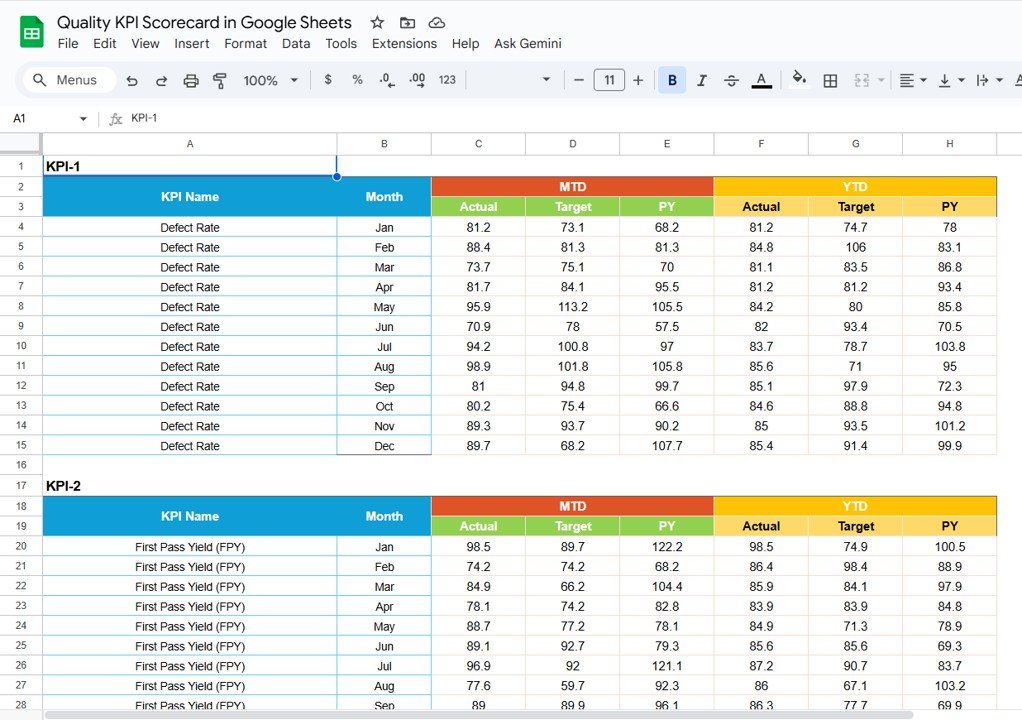
Data Input Sheet Tab
The Data Input Sheet is where users enter actual KPI values for each month.
Data Structure:
- KPI Name
- Month
- MTD Actual
- MTD Target
- YTD Actual
- YTD Target
This data automatically feeds the Scorecard and Trend tabs. Any updates here refresh the dashboard instantly — ensuring accurate and real-time reporting.
Click to Buy Quality KPI Scorecard in Google Sheets
KPI Definition Sheet Tab
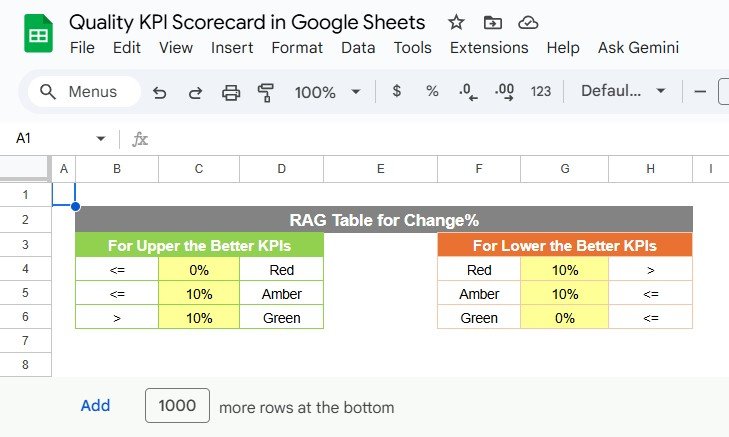
Color Settings
Visual feedback is critical for quick interpretation. The Color Settings define the thresholds for KPI performance visualization:
Click to Buy Quality KPI Scorecard in Google Sheets
Advantages of the Quality KPI Scorecard in Google Sheets
-
Real-Time Visualization: Instantly view KPI progress across months.
-
Automated Performance Insights: Auto-updating traffic lights and arrows reduce manual effort.
-
Customizable Framework: Add or edit KPIs based on your organization’s quality goals.
-
Cloud-Based Collaboration: Multiple users can access and update simultaneously.
-
Data Accuracy: Eliminates manual recalculation errors.
-
Supports MTD and YTD Views: View short-term and long-term quality performance.
-
Transparency: Provides leadership with clear, measurable quality metrics.
Opportunities for Improvement
Click to Buy Quality KPI Scorecard in Google Sheets
Although this dashboard is powerful, several enhancements can make it even better:
-
Automated Data Imports: Connect to production systems or QA databases for real-time updates.
-
Email Alerts: Send notifications when any KPI drops below threshold levels.
-
Drill-Down Analysis: Add departmental filters for detailed investigation.
-
CAPA Integration: Include links to corrective and preventive action logs.
-
Visual Enhancements: Integrate into Google Looker Studio for advanced visuals.
Best Practices for Using the Quality KPI Scorecard
-
Update Monthly: Maintain consistency in data entry.
-
Set SMART KPIs: Ensure each metric is Specific, Measurable, Achievable, Relevant, and Time-bound.
-
Define Thresholds Clearly: Ensure team alignment on what each color/indicator means.
-
Review Trends Regularly: Identify recurring quality issues using the Trend tab.
-
Protect the File: Restrict edit rights to key quality management personnel.
-
Train Teams: Educate users on how to interpret KPIs and take corrective actions.
Conclusion
Click to Buy Quality KPI Scorecard in Google Sheets
The Quality KPI Scorecard in Google Sheets is a dynamic, user-friendly, and cost-effective solution for monitoring key quality metrics. It empowers organizations to make informed decisions, maintain standards, and continuously improve operations through data visualization and automation.
With MTD/YTD toggles, traffic lights, and KPI trends, this dashboard turns data into meaningful insights — helping teams focus on continuous improvement and excellence.
Frequently Asked Questions (FAQ)
1. Can I add more KPIs to this scorecard?
Yes. You can easily add new KPIs by updating the KPI Definition and Data Input sheets.
2. Does it support departmental segmentation?
Yes. You can include a “Department” column in the Data Input sheet and create filters accordingly.
3. Can I automate the data updates?
Yes. By integrating with Google Apps Script or connected databases, data can be imported automatically.
4. Can multiple team members access the scorecard simultaneously?
Yes. Google Sheets allows real-time collaboration and version control.
5. How does the scorecard indicate underperformance?
Through red indicators and downward arrows, highlighting KPIs that are below targets.
Visit our YouTube channel to learn step-by-step video tutorials
Youtube.com/@NeotechNavigators
Watch the step-by-step video Demo: