Rental Property Investment Dashboard in Google Sheets is a professionally designed, data-driven Google Sheets dashboard template built for property investors, landlords, real estate portfolio managers, and financial analysts who want to track every critical aspect of their rental property investments from a single, unified interface. This template includes 6 interactive dashboard pages covering an overview, financial analysis, property performance, occupancy analysis, a smart search page, and a data sheet — making it one of the most comprehensive Google Sheets-based rental property analytics solutions available today.Rental Property Investment Dashboard in Google Sheets
Whether you manage a handful of rental units or a growing portfolio of residential and commercial properties, this dashboard gives you instant visual insights into rental income, expenses, net income, occupancy rates, property manager performance, and much more. All you need to do is make a copy in Google Drive, replace the sample data with your own, and let the dashboard do the rest.
📦 Click here to Purchase Rental Property Investment Dashboard in Google Sheets
Key Features of Rental Property Investment Dashboard in Google Sheets
The Rental Property Investment Dashboard in Google Sheets is packed with powerful features that make rental property portfolio management effortless. Here are the standout capabilities that set this template apart:
- 6 Interactive Dashboard Pages — Overview, Financial Analysis, Property Performance, Occupancy Analysis, Search, and Data Sheet covering every aspect of rental property management.
- Real-Time KPI Cards — Dynamic cards showing Total Properties, Total Rental Income, Total Expenses, Total Net Income, and Avg Monthly Rent that update automatically as you enter data.
- Advanced Slicer Filters — Built-in Google Sheets slicers let you filter dashboards by property type, location, manager, or any custom criteria instantly.Rental Property Investment Dashboard in Google Sheets
- Financial Analysis Module — Deep dive into Expense Ratio, Revenue vs Expenses by Bedrooms, Payment Status Distribution, and Monthly Net Income Trends.
- Property Performance Tracking — Identify Highest and Lowest Rent properties, analyze Rent Spread, Revenue by Property Manager, and Properties per Manager distribution.
- Occupancy Analytics — Monitor Occupancy Rate, Vacant Units, Under Maintenance properties, Occupancy by Property Type, Occupancy Rate by Location, and Monthly Occupancy Trends.
- Smart Search Page — Look up any property by Property ID to instantly view all details including tenant info, lease dates, rent, expenses, and payment status.
- Cloud-Based & Collaborative — Access from anywhere, share with team members, and collaborate in real time without any software installation.
If you work with Excel, you might also be interested in the Rental Property Investment Dashboard in Excel version, or the Power BI version for more advanced interactive analytics.
Dashboard Pages Explained
1. Overview Page
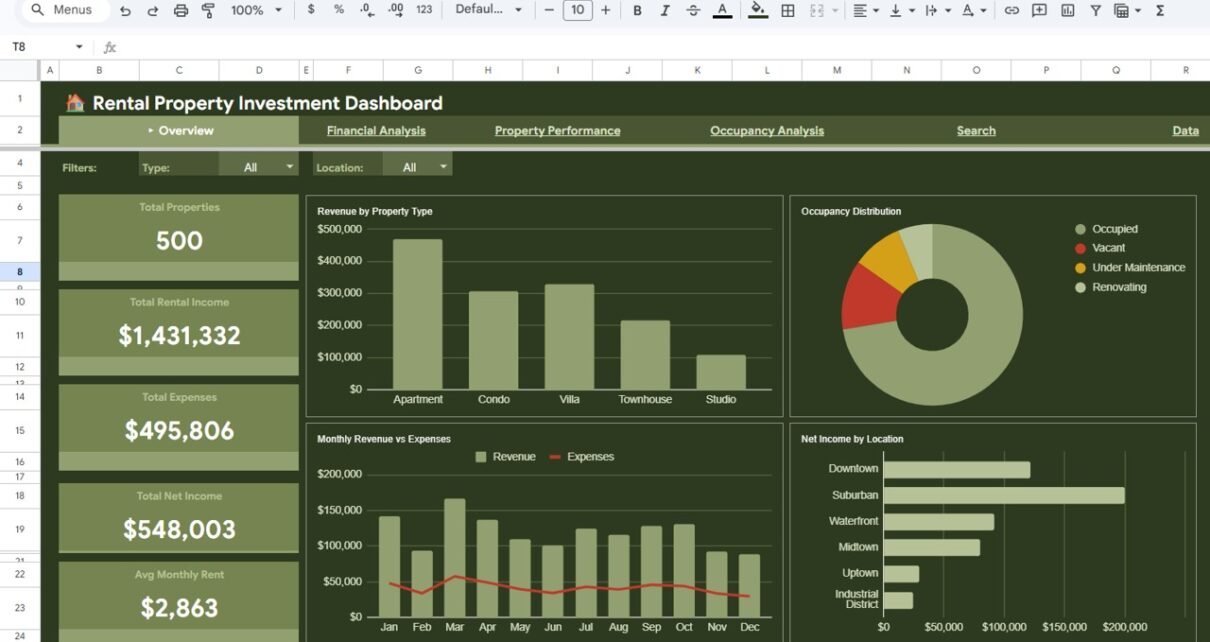
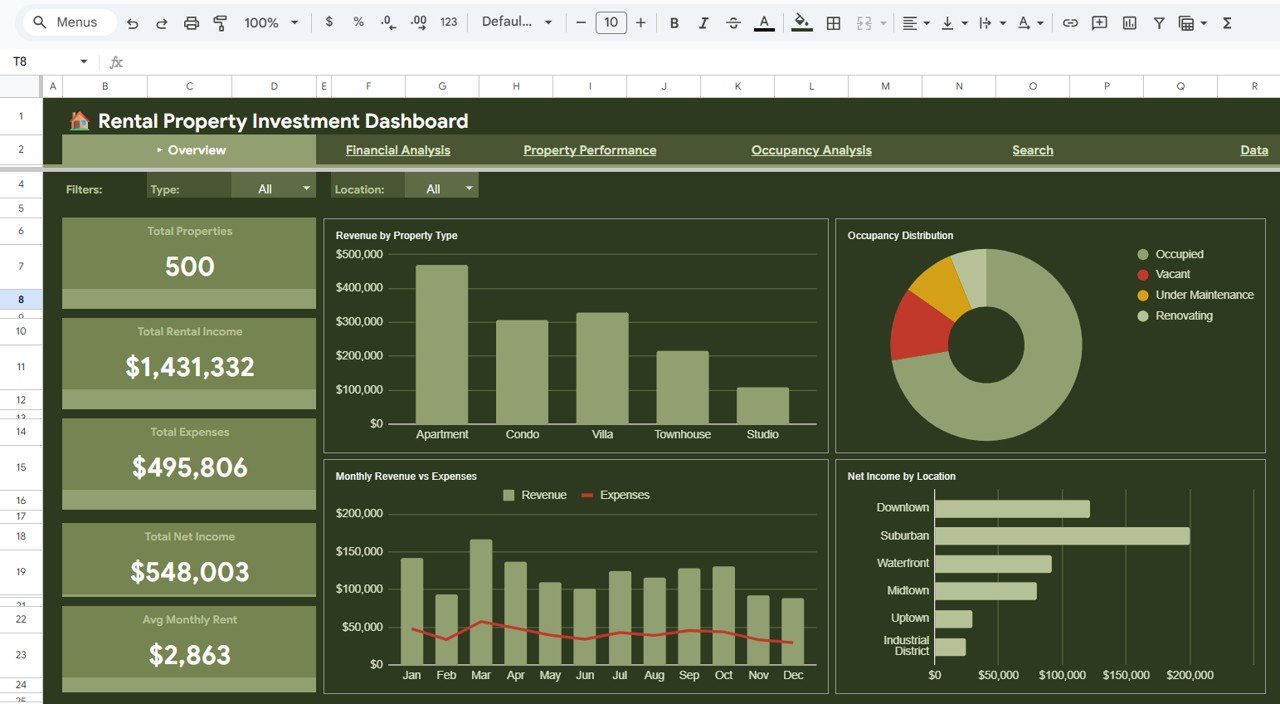
The Overview page serves as your command center for the entire rental property portfolio. At the top, you will find 5 high-level KPI cards displaying Total Properties, Total Rental Income, Total Expenses, Total Net Income, and Avg Monthly Rent — giving you a snapshot of your portfolio’s financial health at a glance.
Below the KPI cards, the dashboard presents several analytical charts including Revenue by Property Type which breaks down your income across different property categories, Monthly Revenue vs Expenses which shows your income and spending patterns over time, Occupancy Distribution which visualizes how your properties are distributed across occupancy statuses, and Net Income by Location which highlights the most and least profitable locations in your portfolio. Multiple slicers are available on this page so you can quickly filter the entire dashboard by property type, location, or any other attribute.
Rental Property Investment Dashboard in Google Sheets — Overview Page2. Financial Analysis
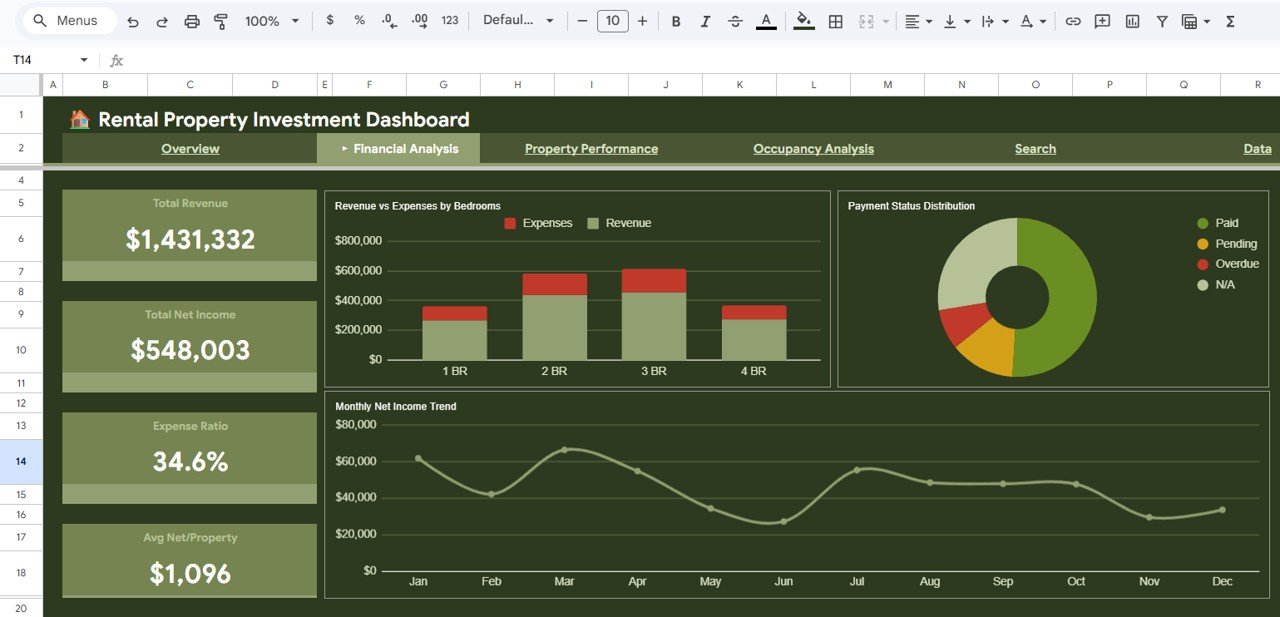
The Financial Analysis page provides a deeper look into the monetary performance of your rental property portfolio. This page features KPI cards for Total Revenue, Total Net Income, Expense Ratio, and Avg Net/Property — key metrics every investor needs to evaluate portfolio profitability.Rental Property Investment Dashboard in Google Sheets
The charts on this page include Revenue vs Expenses by Bedrooms which helps you understand which property sizes are most profitable, Payment Status Distribution which shows how many tenants are current, late, or defaulting on payments, and Monthly Net Income Trend which tracks your bottom line over time to identify growth or decline patterns.
 Financial Analysis
3. Property Performance
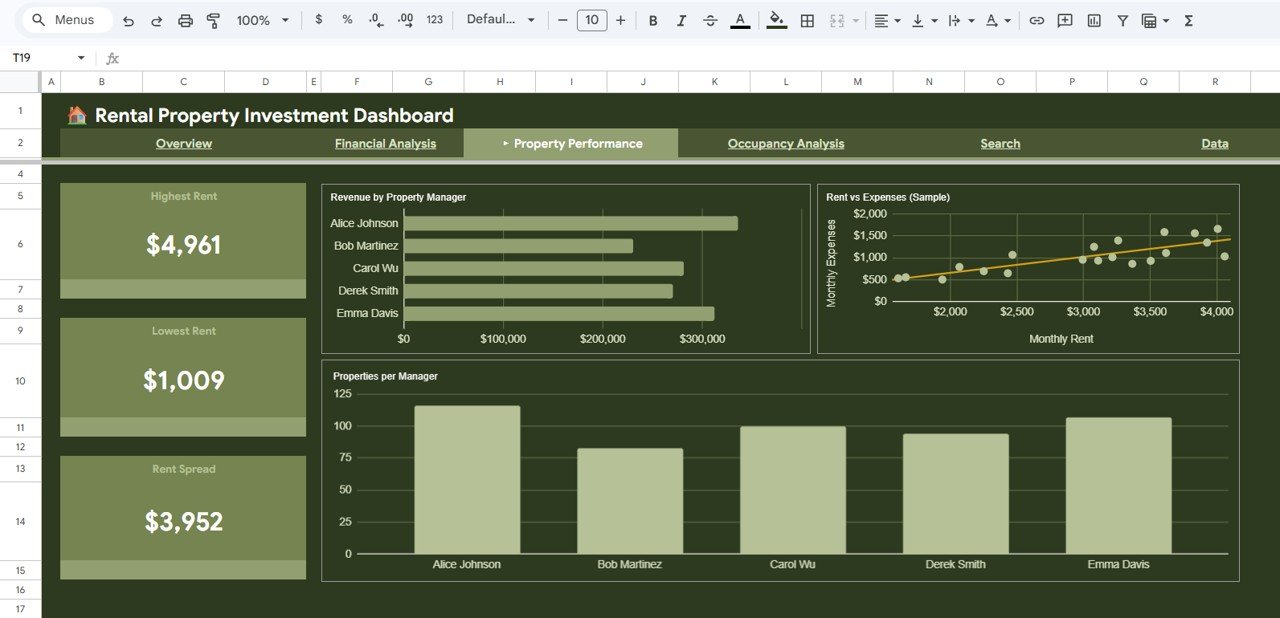
The Property Performance page helps you evaluate individual property and manager-level metrics. KPI cards show your Highest Rent, Lowest Rent, and Rent Spread — helping you quickly see the range of rental income across your portfolio.
The analysis charts include Revenue by Property Manager which shows how much revenue each manager is generating, Rent vs Expenses (Sample) which provides a side-by-side comparison for selected properties, and Properties per Manager which visualizes workload distribution across your property management team. This page is essential for identifying top-performing properties and managers that drive the most value.
 Property Performance
4. Occupancy Analysis
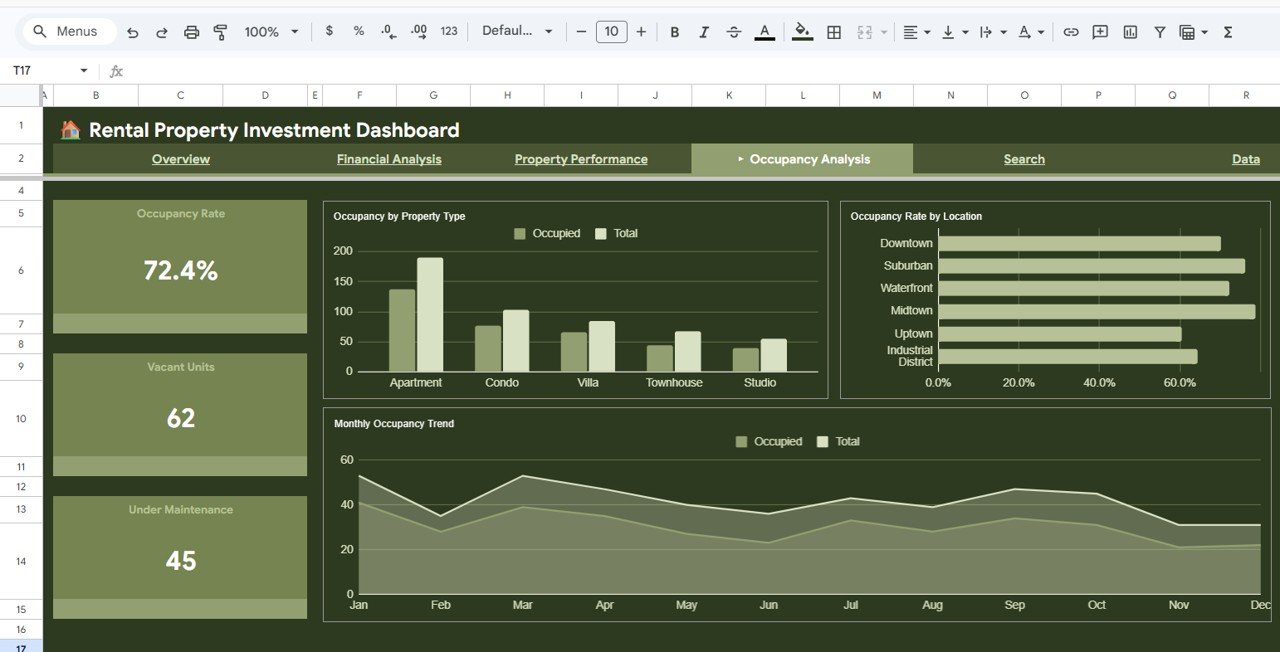
The Occupancy Analysis page is dedicated to tracking how effectively your properties are being utilized. The KPI cards display Occupancy Rate, Vacant Units, and Under Maintenance counts — critical metrics for any landlord or property manager.
The page includes Occupancy by Property Type which shows occupancy distribution across apartments, houses, condos, and other property types, Occupancy Rate by Location which reveals geographic trends in vacancy, and Monthly Occupancy Trend which helps you track seasonal patterns and identify periods when vacancy tends to spike. Use this page to proactively reduce vacancy and maximize rental income. You can also check our related Vacation Rental KPI Dashboard in Google Sheets for short-term rental occupancy tracking.
 Occupancy Analysis
5. Search Page
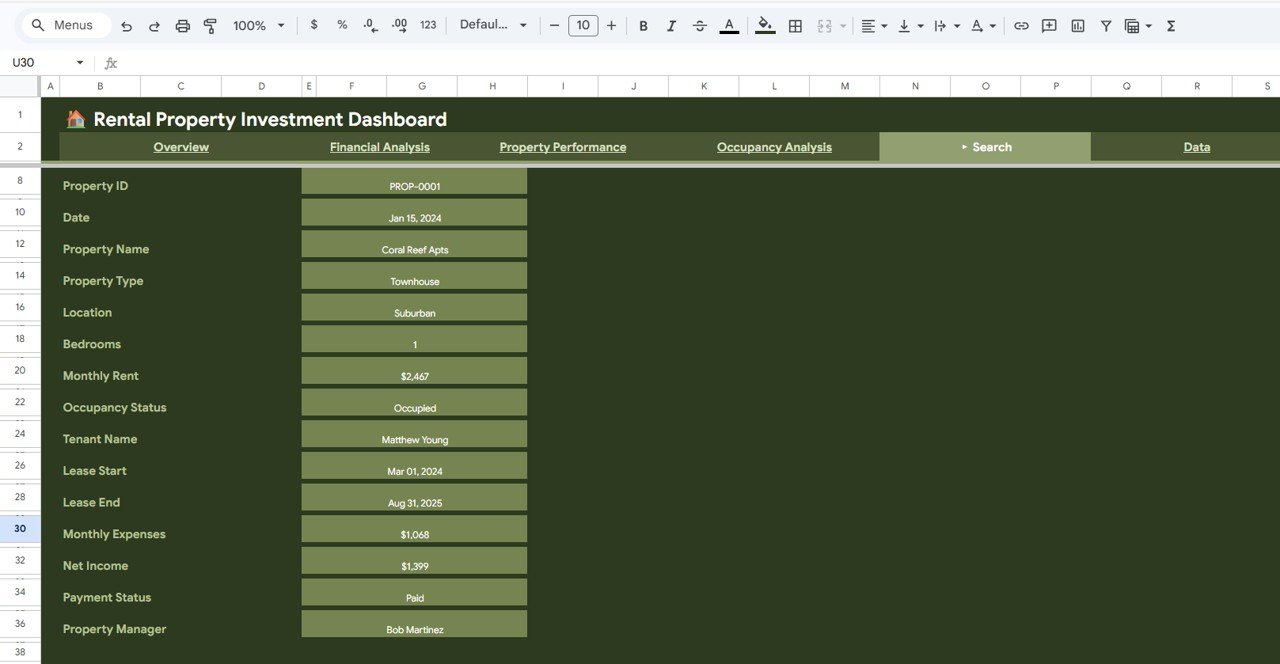
The Search page provides a convenient way to look up any individual property record in your portfolio. Simply select a Property ID from the dropdown and the page instantly displays all key details including Property Name, Property Type, Location, Bedrooms, Monthly Rent, Occupancy Status, Tenant Name, Lease Start, Lease End, Monthly Expenses, Net Income, Payment Status, and Property Manager.Rental Property Investment Dashboard in Google Sheets
This is incredibly useful for quick property lookups during meetings, tenant inquiries, or when you need to pull up specific property information without scrolling through the data sheet. Learn more about building similar search functionality in our Property Management KPI Dashboard in Google Sheets tutorial.
 Search Sheet Tab
6. Data Sheet
The Data Sheet is where all your rental property records are stored. This is the foundation of the entire dashboard — you simply need to add your data in the same structured format provided in the sample, and every dashboard page, chart, and KPI card will auto-update to reflect your actual portfolio data. The columns include Property ID, Property Name, Property Type, Location, Bedrooms, Monthly Rent, Occupancy Status, Tenant Name, Lease Start, Lease End, Monthly Expenses, Net Income, Payment Status, and Property Manager.
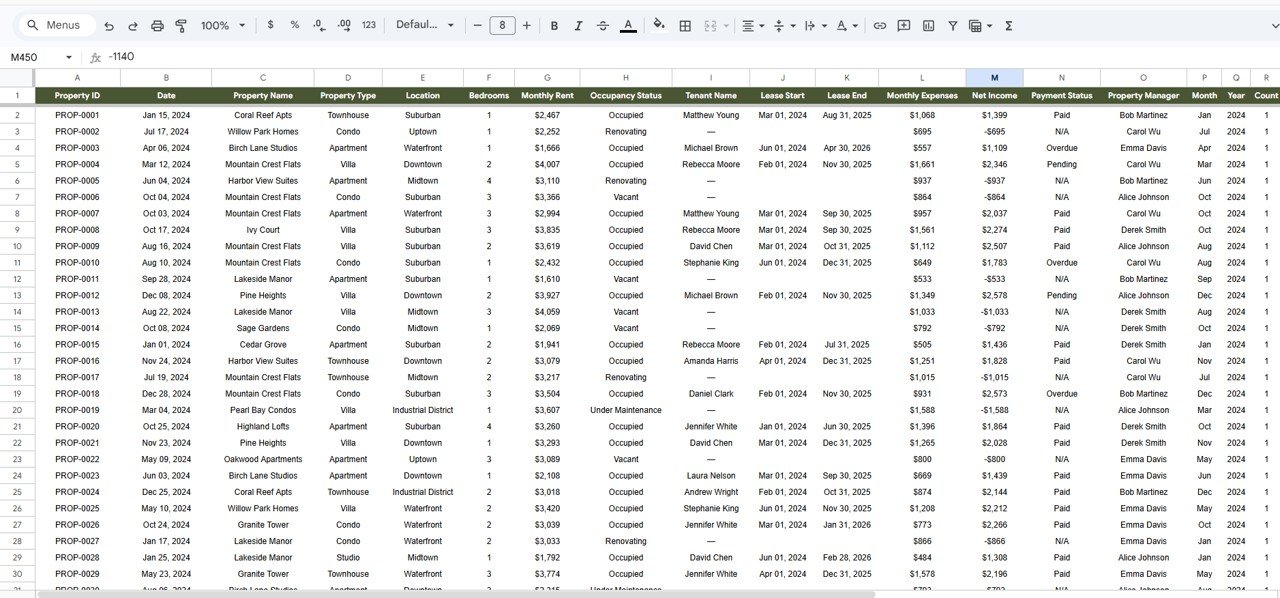 Data Sheet Tab
Advantages of Rental Property Investment Dashboard in Google Sheets
- Complete Portfolio Visibility — Get a 360-degree view of your rental portfolio with financial, performance, and occupancy insights all in one place.
- No Software Required — Everything runs in Google Sheets, so there is no need to install Excel, Power BI, or any other desktop application.
- Real-Time Collaboration — Share with partners, property managers, or accountants and work simultaneously from anywhere in the world.
- Instant Updates — Change data in the Data sheet and watch all 5 dashboard pages refresh automatically with your new numbers.
- Professional Design — Clean, modern charts and KPI cards that are presentation-ready for investor meetings or management reviews.
- Cost-Effective — A one-time purchase that replaces expensive property management software for basic analytics needs.
Opportunities for Improvement
- Automated Data Import — Currently requires manual data entry; future versions could integrate with property management APIs for automatic data syncing.
- Multi-Currency Support — Adding currency conversion options would benefit international property investors managing assets across different countries.
- Historical Trend Comparison — Year-over-year comparison charts would help investors identify long-term portfolio performance patterns.
- Tax Calculation Module — Integrating property tax and depreciation calculations would make the dashboard even more valuable for financial planning.
Best Practices for Using This Dashboard
- Update Data Regularly — Keep your Data sheet current by updating rental income, expenses, and occupancy status at least monthly for accurate insights.
- Use Slicers Strategically — Leverage the built-in slicer filters on the Overview page to quickly drill down into specific property types, locations, or managers.
- Monitor Vacancy Trends — Check the Occupancy Analysis page weekly to catch rising vacancy rates early and take corrective action before they impact your bottom line.
- Compare Manager Performance — Use the Property Performance page to evaluate which property managers deliver the best revenue and occupancy results.
- Share with Stakeholders — Take advantage of Google Sheets sharing to give read-only access to investors or partners who need portfolio visibility.
For more real estate portfolio dashboards, explore our complete collection of Google Sheets templates.
Explore Relevant Templates
- Rental Property Investment Dashboard in Excel — The same powerful rental analytics built in Microsoft Excel.
- Rental Property Investment Dashboard in Power BI — Advanced interactive rental analytics with Power BI.
- Vacation Rental KPI Dashboard in Google Sheets — Specialized for short-term vacation rental tracking.
- Rental Property Investment Dashboard in HTML — Browser-based interactive rental dashboard.
- All Google Sheets Dashboard Templates — Browse our full collection.
Frequently Asked Questions
📦 Click here to Purchase Rental Property Investment Dashboard in Google Sheets
What is the best Google Sheets template for tracking rental property investments?
The Rental Property Investment Dashboard in Google Sheets is one of the best templates available for tracking rental property investments. It includes 6 interactive dashboard pages covering financial analysis, property performance, occupancy analytics, and a smart search page — providing complete portfolio visibility without any software installation.
How do I track rental income and expenses in Google Sheets?
You can track rental income and expenses in Google Sheets using the Rental Property Investment Dashboard template. Simply enter your property records in the Data sheet with columns for Monthly Rent and Monthly Expenses, and the dashboard automatically calculates Total Rental Income, Total Expenses, Net Income, Expense Ratio, and visualizes trends with interactive charts.
Can I use this dashboard for multiple rental properties?
Yes. The Rental Property Investment Dashboard in Google Sheets is designed to handle hundreds of property records. Each property gets its own row in the Data sheet, and all 6 dashboard pages scale automatically to reflect your full portfolio with KPI cards, charts, and filters.
Does this rental property dashboard work on mobile devices?
Yes. Since it is built in Google Sheets, you can access and view the dashboard on any device with the Google Sheets app or mobile browser. However, for the best interactive experience with slicers and charts, a desktop or tablet screen is recommended.
What occupancy metrics does this dashboard track?
The Occupancy Analysis page tracks Occupancy Rate, Vacant Units, Under Maintenance count, Occupancy by Property Type, Occupancy Rate by Location, and Monthly Occupancy Trend — giving landlords and property managers complete visibility into portfolio utilization and vacancy patterns.
Is this dashboard available in Excel or Power BI?
Yes. NextGenTemplates offers the Rental Property Investment Dashboard in multiple platforms including Excel, Power BI, and HTML formats to suit different user preferences and technical requirements.
Conclusion
The Rental Property Investment Dashboard in Google Sheets is an essential tool for anyone managing rental properties. With 6 interactive dashboard pages, real-time KPI tracking, advanced slicer filters, and cloud-based collaboration, it provides everything you need to monitor rental income, expenses, occupancy, and property performance from a single spreadsheet. Whether you are a solo landlord or managing a large portfolio, this dashboard helps you make data-driven decisions that maximize returns and minimize risk.
📦 Click here to Purchase Rental Property Investment Dashboard in Google Sheets
👉 Visit our YouTube channel for step-by-step tutorials: YouTube.com/@NeoTechNavigators