Managing a retail business involves tracking various key metrics such as sales, discount rates, and quantities sold. The Retail Dashboard in Google Sheets offers a convenient and efficient way to monitor these metrics in one place. This ready-to-use template helps you visualize data and make informed decisions for your retail operations.
In this article, we will explore the features and functionality of the Retail Dashboard in Google Sheets, highlighting the various charts, cards, and data points available to help track and analyze your retail performance.
What is the Retail Dashboard in Google Sheets?
The Retail Dashboard in Google Sheets is a powerful tool that helps retail businesses track and analyze key performance metrics (KPIs) such as gross sales, total sales amount, discounts, and quantities sold. The dashboard uses a combination of cards, charts, and tables to display data in a visual format, making it easier to interpret and use for decision-making.
Key Features of the Retail Dashboard
Click to buy Retail Dashboard in Google Sheets
The Retail Dashboard in Google Sheets consists of several key components:
1. Dashboard Sheet Tab
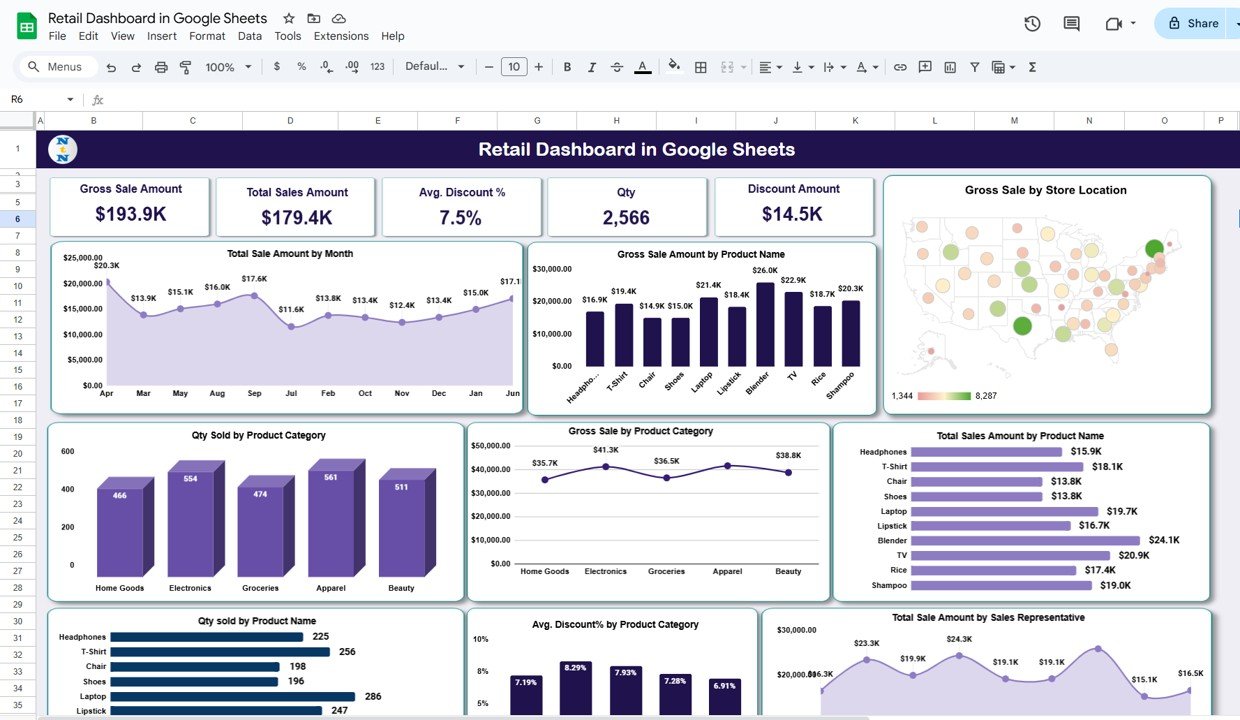
This is the main sheet tab where you can view all your key retail metrics. The dashboard is organized into cards and charts that provide visual insights into your retail performance.
Cards:
-
Gross Sale Amount: Displays the total gross sales amount.
-
Total Sales Amount: Shows the total sales amount after any discounts.
-
Avg. Discount %: Displays the average discount percentage applied to sales.
-
Qty: Shows the total quantity of items sold.
-
Discount Amount: Shows the total amount of discounts applied to sales.
Charts:
The charts in the dashboard visually represent various aspects of your retail performance:
-
Gross Sale by Store Location: A chart that shows the gross sales amount broken down by store location.
-
Total Sales Amount by Month: A chart that visualizes the total sales amount by month, helping you track sales trends over time.
-
Gross Sale Amount by Product Name: Displays the gross sales amount by individual products, allowing you to identify bestsellers.
-
Qty Sold by Product Category: A chart that shows the total quantity sold by product category.
-
Gross Sale by Product Category: Visualizes the gross sales amount broken down by product category.
-
Total Sales Amount by Product Name: Displays the total sales amount by product name.
-
Qty Sold by Product Name: Tracks the total quantity sold by each product name.
-
Avg. Discount % by Product Category: Shows the average discount percentage applied within each product category.
-
Total Sales Amount by Sales Representative: Visualizes sales performance by each sales representative, helping you track individual contributions.

Click to buy Retail Dashboard in Google Sheets
2. Data Sheet Tab
The Data Sheet Tab serves as the input section for your sales data. This is where you enter the raw data for your retail business, which the dashboard will use to calculate the KPIs and update the charts

Click to buy Retail Dashboard in Google Sheets
Benefits of Using the Retail Dashboard in Google Sheets
The Retail Dashboard in Google Sheets offers several advantages for managing and analyzing retail operations:
-
Centralized Data Management: The dashboard consolidates all your key retail metrics in one place, making it easier to track performance.
-
Real-Time Insights: By regularly updating the data sheet, the dashboard provides real-time insights into your retail business performance.
-
Data Visualization: The use of charts and graphs makes it easier to visualize trends and understand how different factors, like location and product category, impact sales.
-
Customizable: The template can be easily customized to fit the specific needs of your retail business, whether you are tracking a few products or a large inventory.
-
Improved Decision-Making: The dashboard helps you make informed decisions by providing clear visual insights into your sales performance, discounts, and inventory levels.
Advantages of Using the Retail Dashboard
Click to buy Retail Dashboard in Google Sheets
The Retail Dashboard in Google Sheets provides several benefits:
- Real-Time Performance Tracking: You can track performance as it happens, ensuring you stay on top of sales trends and identify issues early.
- Efficient Reporting: The dashboard automatically generates reports based on the data you input, saving time and effort compared to manual reporting.
- Improved Sales Strategy: With clear visual insights, you can identify areas for improvement and adjust your sales strategy accordingly.
- Customization for Specific Needs: You can tailor the dashboard to match the unique needs of your retail business, including adding or removing KPIs as necessary.
Best Practices for Using the Retail Dashboard
To get the most out of your Retail Dashboard in Google Sheets, consider the following best practices:
-
Update the Data Regularly: To keep the dashboard accurate and up-to-date, enter new sales data regularly.
-
Review Key Metrics: Regularly monitor the dashboard’s KPIs and charts to stay on top of sales performance.
-
Track Trends Over Time: Use the charts to track sales trends and identify patterns or changes in performance.
-
Customize for Your Needs: Tailor the dashboard to focus on the KPIs that matter most for your retail business.
-
Share Insights with Your Team: Use the dashboard to share important sales insights with your team and drive better decision-making.
Conclusion
Click to buy Retail Dashboard in Google Sheets
The Retail Dashboard in Google Sheets is an essential tool for retail businesses looking to streamline their sales tracking and improve decision-making. By providing clear visual insights into key metrics like sales performance, discounts, and inventory levels, this dashboard helps businesses monitor progress and make data-driven decisions.
Frequently Asked Questions (FAQs)
1. What KPIs are tracked in the Retail Dashboard?
The dashboard tracks KPIs such as gross sales, total sales amount, discount percentage, and quantity sold.
2. Can I customize the Retail Dashboard?
Yes, the dashboard is customizable. You can add or remove KPIs, adjust the layout, and tailor the charts to fit your business needs.
3. How do I update the Retail Dashboard?
Simply enter your sales data into the Data Sheet Tab, and the dashboard will automatically update the charts and KPIs.
4. Can I use the Retail Dashboard for multiple stores?
Yes, the dashboard can be customized to track multiple store locations and compare performance across different locations.
5. How often should I update the Retail Dashboard?
You should update the dashboard regularly, especially at the end of each week or month, to keep track of sales trends and performance.
Visit our YouTube channel to learn step-by-step video tutorials
Youtube.com/@NeotechNavigators
Click to buy Retail Dashboard in Google Sheets