Retail businesses generate large volumes of data every day. Sales transactions, product performance, discounts, store activity, customer purchases, and sales team output all create important insights. However, if this data stays scattered across spreadsheets and reports, decision-making becomes slow and difficult.
That is why businesses need a dashboard that can turn raw retail data into clear, interactive, and visual insights. This is exactly where a Retail Dashboard in HTML becomes extremely useful.
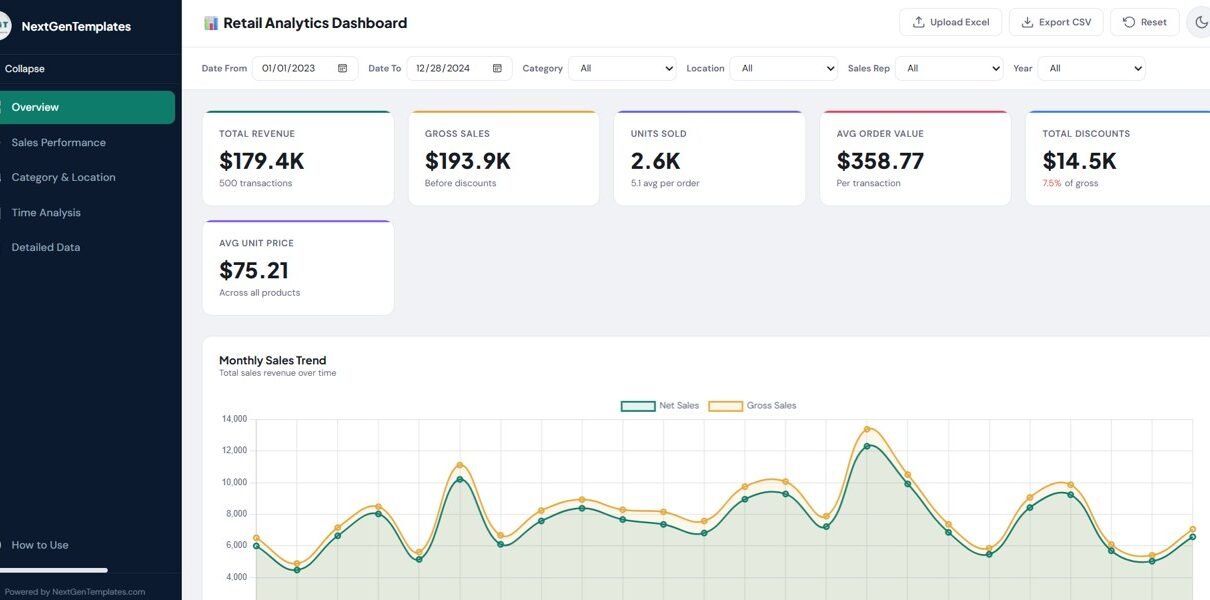
A well-designed Retail Dashboard in HTML gives retailers a modern and flexible way to analyze sales performance, category trends, store activity, and time-based patterns in a browser-based interface. Instead of relying only on static reports, users can filter data, upload files, switch views, explore charts, and export records quickly. In the uploaded dashboard file, the interface includes a sidebar, a topbar, global filters, KPI cards, chart pages, a detailed data table, export options, theme toggle, and Excel upload support.
In this article, you will learn everything about the Retail Dashboard in HTML, including its features, benefits, use cases, workflow, best practices, and why it can become a powerful digital product for modern businesses.
What Is a Retail Dashboard in HTML?
Click to Buy Retail Dashboard in HTML
A Retail Dashboard in HTML is a browser-based analytics dashboard built using web technologies such as HTML, CSS, and JavaScript. It helps businesses visualize and analyze retail data in an interactive way.
Instead of opening many different spreadsheets, users can view important retail metrics on one screen. They can also move across multiple analysis pages and interact with filters to study the data from different angles. In the uploaded dashboard, users can move through Overview, Sales Performance, Category & Location, Time Analysis, Detailed Data, and How to Use sections by using the sidebar navigation.
- Retail store owners
- Chain store managers
- E-commerce sellers
- Sales analysts
- Category managers
- Business consultants
- Dashboard template sellers
Because it runs in the browser, it delivers a more modern and professional experience than a plain spreadsheet report.
Why Should Retail Businesses Use an HTML Dashboard?
Retail data changes quickly. Sales teams need fast answers, not delayed reporting. Therefore, a browser-based dashboard gives a major advantage.
A retail HTML dashboard helps businesses:
- Track sales performance clearly
- Analyze products and categories faster
- Monitor store locations easily
- Review discounts and revenue patterns
- Filter data across multiple dimensions
- Present insights in a professional interface
Moreover, an HTML dashboard looks premium and interactive. This makes it ideal not only for internal use but also for product demos, client presentations, and online template marketplaces.
In the uploaded file, the dashboard uses an interactive layout with a collapsible sidebar, sticky topbar, filter bar, charts, tables, and responsive components. That structure makes the user experience feel more like a SaaS product than a basic report.
Retail Analytics Dashboard in E…
What Are the Main Features of This Retail Dashboard in HTML?
Click to Buy Retail Dashboard in HTML
The uploaded dashboard contains several strong features that make it both practical and visually appealing.
1. Modern Interface Design
The dashboard uses a polished UI with:
- A fixed sidebar
- A sticky topbar
- Card-based KPI sections
- Chart containers
- Interactive tables
- Smooth transitions
- Light and dark theme support
The styling includes color variables, card shadows, responsive layouts, hover effects, and theme-based design tokens for both light and dark modes.
Retail Analytics Dashboard in E…
This matters because a dashboard should not only work well but also look professional.
2. Global Filter Bar
The filter bar allows users to narrow the data using:
- Date From
- Date To
- Category
- Location
- Sales Rep
- Year
These filters apply across the dashboard, allowing users to move from broad analysis to detailed insights quickly.
Retail Analytics Dashboard in E…
3. Demo Data + Real File Upload
Click to Buy Retail Dashboard in HTML
The dashboard includes a banner showing that demo data is being used and invites users to upload their original Excel file. The upload workflow supports .xlsx and .xls files, and the modal includes drag-and-drop support, sheet selection, and local file loading.
This feature adds huge value because users can test the dashboard instantly and then replace demo data with their own retail dataset.
4. KPI Cards
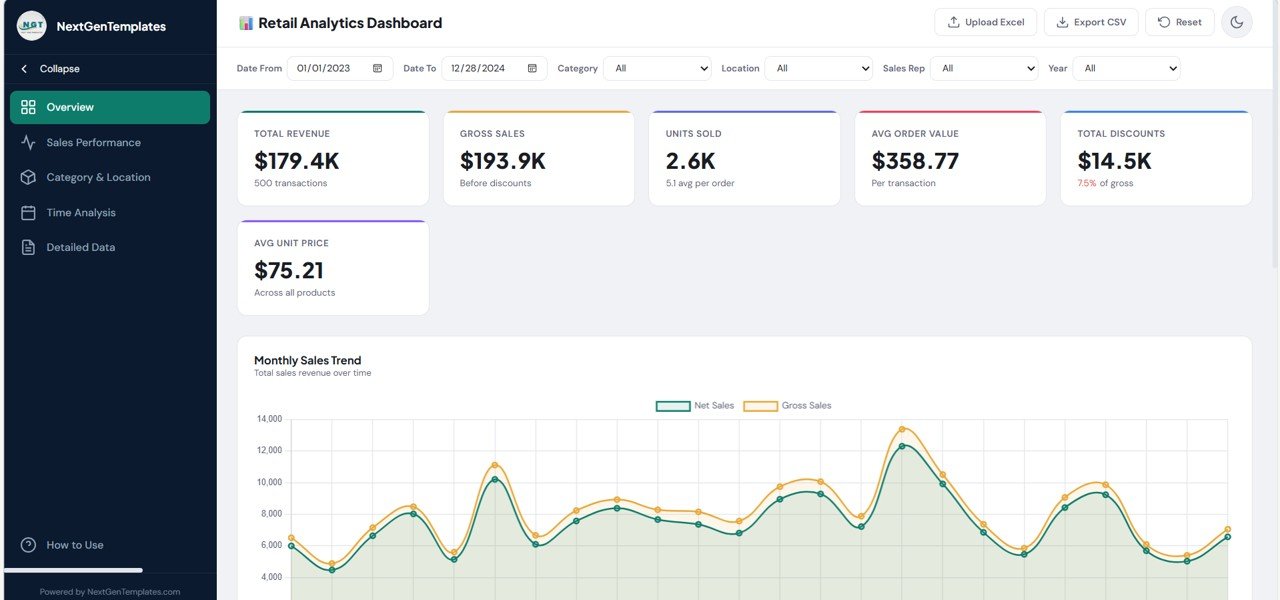
The overview page uses KPI cards to display headline metrics. The file shows a dedicated KPI grid for top-level performance tracking.
Retail Analytics Dashboard in E…
KPI cards are important because they summarize performance before the user dives deeper into chart analysis.
5. Multi-Page Analytics
The dashboard includes navigation for:
- Overview
- Sales Performance
- Category & Location
- Time Analysis
- Detailed Data
- How to Use
This page structure improves clarity and prevents the dashboard from becoming overcrowded.
6. Detailed Data Table
The detailed data section includes:
- Search transactions
- Export CSV
- Sortable columns
- Pagination
- Scrollable data table
These features help users move from summary analytics to record-level analysis.
7. Theme Toggle
Click to Buy Retail Dashboard in HTML
The dashboard supports both light mode and dark mode, and the “How to Use” section explains that theme preference is saved automatically.
8. Responsive Design
The dashboard adapts to smaller screens by resizing charts and collapsing the sidebar automatically. The “How to Use” section explicitly highlights responsive design support across devices.
Which Pages Make This Retail Dashboard More Powerful?
A good dashboard should separate insights into logical sections. This uploaded HTML dashboard does that well.
Overview Page
The Overview page contains a KPI grid and major charts. One clearly visible chart on this page is Monthly Sales Trend, described as total sales revenue over time.
Retail Analytics Dashboard in E…
This page works as the executive summary.
Click to Buy Retail Dashboard in HTML
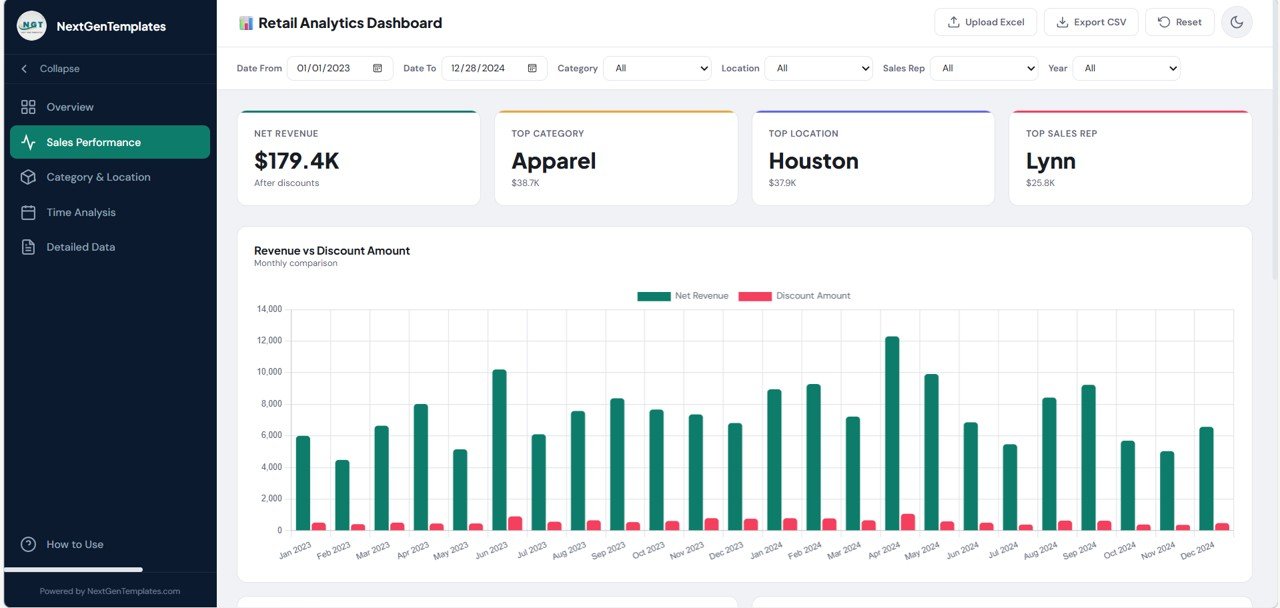
Sales Performance Page
The sidebar navigation confirms a dedicated Sales Performance tab. This helps users focus specifically on revenue, transaction value, and sales output.
Retail Analytics Dashboard in E…
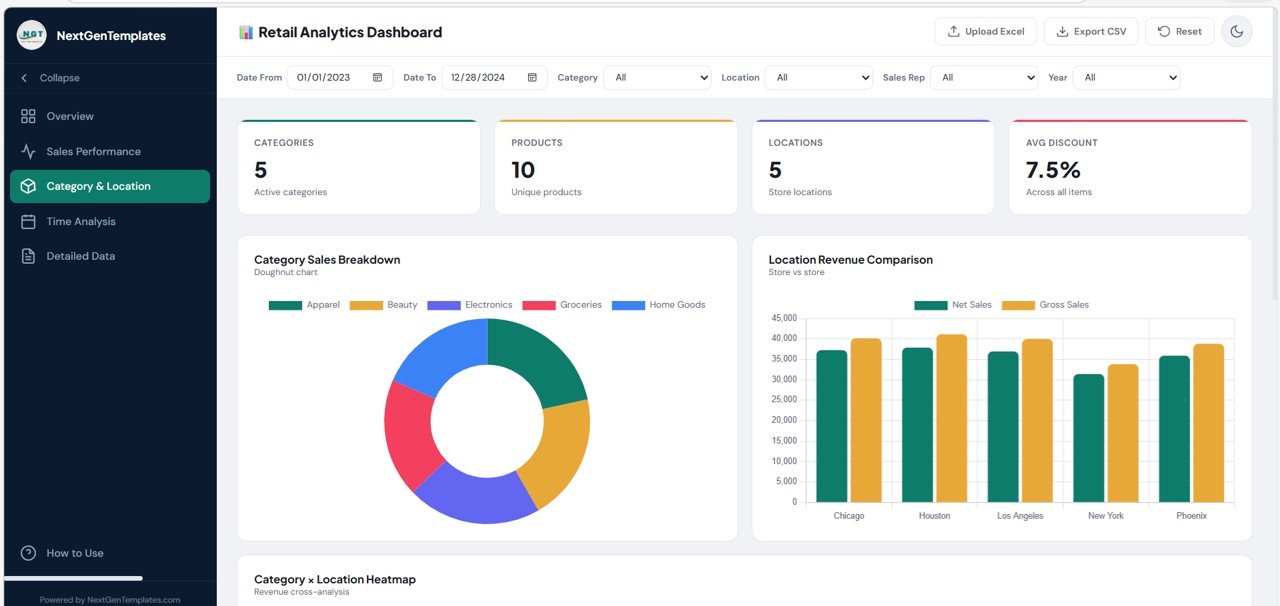
Category & Location Page
The dashboard also includes Category & Location analysis, which is extremely useful in retail. Category insights help identify high-performing product groups, while location insights show which stores or regions drive results.
Retail Analytics Dashboard in E…
Click to Buy Retail Dashboard in HTML
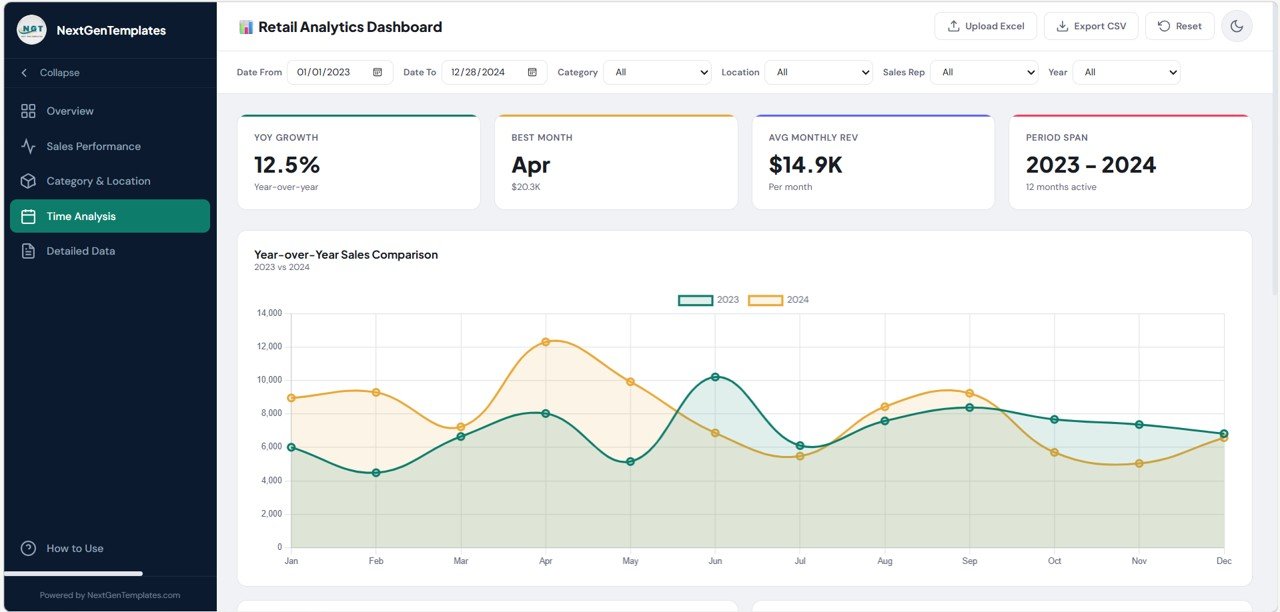
Time Analysis Page
The HTML includes a Time Analysis section and chart references such as Daily Sales Distribution and a transaction count chart. The dashboard describes Daily Sales Distribution as revenue by day of week.
Retail Analytics Dashboard in E…
This kind of analysis helps reveal seasonality and sales timing patterns.
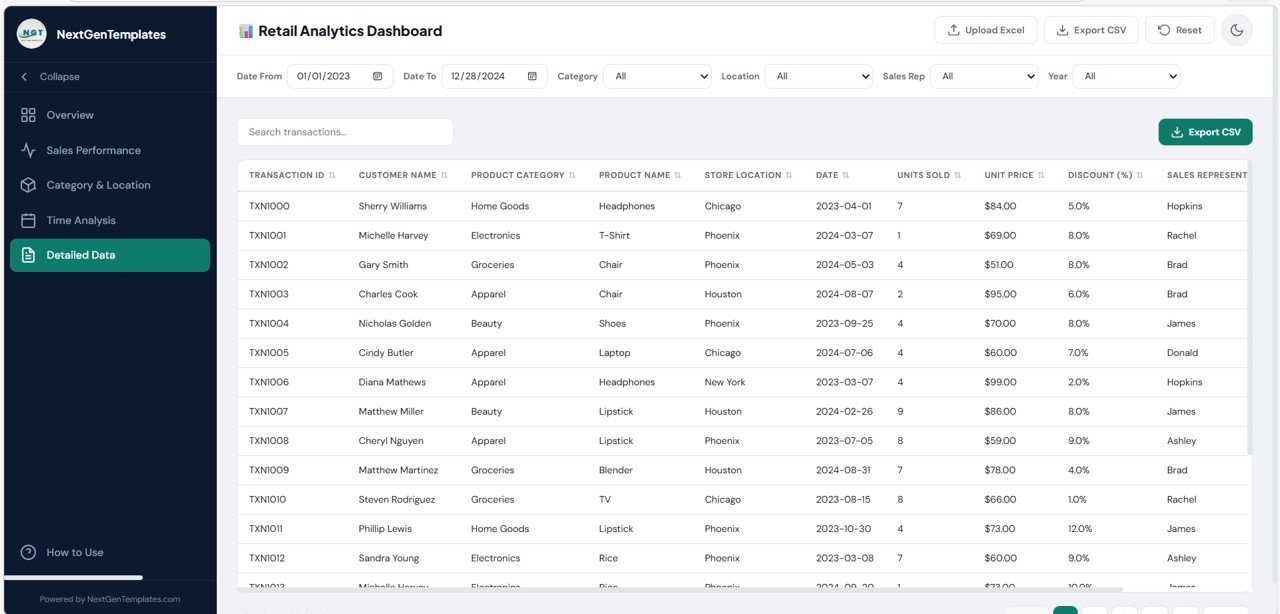
Detailed Data Page
This page provides a search box, export button, sortable table, and pagination. That makes it ideal for transaction-level validation and operational review.
Retail Analytics Dashoard in E…
Click to Buy Retail Dashboard in HTML
How to Use Page
The dashboard even includes a helpful guide page explaining upload flow, filters, tabs, export, theme toggle, responsive design, supported columns, privacy, and tips.
That is a very strong product feature because it reduces user confusion and improves adoptio
Advantages of the Retail Dashboard in HTML
A strong retail HTML dashboard offers many practical benefits.
Better Sales Visibility
Managers can review revenue, trends, and retail activity in one place instead of checking many reports.
Faster Decision-Making
Because filters and charts update quickly, users can spot issues and opportunities faster.
Professional User Experience
The sidebar, cards, charts, and theme toggle create a premium feel that looks far more polished than a static spreadsheet.
Retail Analytics Dashboard in E…
Easy Data Exploration
Users can filter by date, category, location, sales rep, and year, which makes analysis flexible.
Retail Analytics Dashboard in E…
Secure Local Processing
The file states that all processing happens locally in the browser and no data is sent to a server. That adds a strong privacy benefit.
Export Support
Users can export filtered data to CSV for additional analysis.
Responsive Access
The dashboard adjusts for smaller screens, which improves usability on multiple devices.
Retail Analytics Dashboard in E…
Opportunities for Improvement in the Retail Dashboard in HTML
Click to Buy Retail Dashboard in HTML
Although this dashboard is already strong, a few additions could make it even better.
Add Customer Analysis
A dedicated customer page could show repeat customers, average basket size, and top buyers.
Add Profitability KPIs
The current supported columns clearly cover sales fields. Adding cost and margin columns could expand the dashboard into profit analysis. This is an improvement idea beyond the current file structure.
Retail Analytics Dashboard in E…
Add Store Ranking Cards
Location analysis could become even stronger with best-performing and worst-performing store highlights.
Add Product Drill-Down
Users could click a category and then see product-level details.
Add Saved Views
Retail managers often review the same filter combinations. Saved filters would improve convenience.
Add Trend Comparisons
Month-over-month and year-over-year comparisons could strengthen time analysis further.
Best Practices for a Retail Dashboard in HTML
To make a dashboard like this more valuable, follow these best practices.
Keep the Data Clean
Use consistent column names and standard date formats. The dashboard’s own tips mention that column headers should match expected names and dates should be in standard format.
Retail Analytics Dashboard in E…
Use Real Business KPIs
Do not fill the dashboard with too many weak metrics. Focus on revenue, units, discount impact, top categories, top stores, and sales team performance.
Make Navigation Simple
This uploaded dashboard already follows a good multi-page navigation style. Keeping sections focused improves usability.
Retail Analytics Dashboard in E…
Use Demo Data for Product Marketing
The demo data banner is a smart feature. It helps buyers understand the dashboard before they upload real files.
Retail Analytics Dashboard in E…
Provide a “How to Use” Page
Click to Buy Retail Dashboard in HTML
This dashboard does that very well. A built-in help section improves user experience and reduces support requests.
Support Export Options
CSV export is already included, and that is an excellent feature for practical business use.
Conclusion
A Retail Dashboard in HTML is more than a stylish reporting tool. It is a smart way to turn retail data into clear, interactive, and browser-based business intelligence.
The uploaded dashboard already shows many premium features, including sidebar navigation, KPI cards, chart pages, global filters, detailed data search, CSV export, Excel upload, theme toggle, responsive design, and local data privacy.
Because of these capabilities, this type of dashboard can serve retailers, analysts, consultants, and template sellers very well. It helps businesses monitor performance, explore data quickly, and present insights in a far more modern way.
If you want to build a digital product that looks professional and delivers real value, a Retail Dashboard in HTML is an excellent choice.
Frequently Asked Questions
Click to Buy Retail Dashboard in HTML
What is a Retail Dashboard in HTML?
A Retail Dashboard in HTML is a browser-based analytics dashboard that helps users monitor sales, categories, locations, time trends, and transaction-level data through an interactive interface.
Can users upload their own Excel file into this dashboard?
Yes. The uploaded file includes an Excel upload modal that supports .xlsx and .xls files, sheet selection, and local file loading.
Retail Analytics Dashboard in E…
Which filters are available in this dashboard?
The global filters shown in the file are Date From, Date To, Category, Location, Sales Rep, and Year.
Retail Analytics Dashboard in E…
Does this dashboard support export?
Yes. The detailed data section includes an Export CSV option.
Retail Analytics Dashboard in E…
Is the dashboard mobile-friendly?
Yes. The file includes responsive design rules, and the “How to Use” section states that the dashboard works across devices and that the sidebar auto-collapses on smaller screens.
Is user data private?
According to the dashboard’s help section, all processing happens locally in the browser and no data is sent to any server.
What columns should the retail dataset contain?
The file lists Transaction ID, Customer Name, Product Category, Product Name, Store Location, Date, Units Sold, Unit Price, Discount (%), Sales Representative, Discount Amount, Gross Sale, Total Sales, Month, and Year.
Visit our YouTube channel to learn step-by-step video tutorials
Youtube.com/@NeotechNavigators
Watch the step-by-step video tutorial: