Sales performance directly drives business growth. However, when organizations track sales targets, actuals, and performance manually, they often lose visibility and speed. Therefore, modern sales teams need a centralized, visual, and interactive reporting system.
That is exactly where a Sales Performance Management Dashboard in Google Sheets becomes a game-changer.
In this article, we explain how the Sales Performance Management Dashboard in Google Sheets works, each dashboard page, key KPIs, filters, analysis views, advantages, best practices, and frequently asked questions. By the end, you will clearly understand how this dashboard supports data-driven sales decisions.
What Is a Sales Performance Management Dashboard in Google Sheets?
A Sales Performance Management Dashboard in Google Sheets is a ready-to-use analytics solution that tracks sales targets, actual sales, variance, and performance status in one place.
Instead of reviewing multiple reports, sales managers and leaders use this dashboard to:
- Monitor target vs actual sales
- Track achieved and not achieved targets
- Analyze performance by product, region, and sales rep
- Identify high performers and underperformers
- Review monthly and yearly sales trends
Because Google Sheets supports slicers, formulas, charts, and conditional formatting, this dashboard remains powerful, flexible, and collaborative.
Why Do Organizations Need a Sales Performance Management Dashboard?
Click to Buy Sales Performance Management Dashboard in Google Sheets
Sales teams work in fast-moving environments. Therefore, delayed or unclear reporting often results in missed opportunities.
A Sales Performance Management Dashboard helps organizations:
- Improve sales visibility
- Increase accountability
- Track performance against targets
- Support management reviews
- Drive strategic sales decisions
As a result, businesses move from reactive sales tracking to proactive sales management.
How Does the Sales Performance Management Dashboard Work?
The dashboard works through structured data input and multiple interactive analysis pages.
Sales data is entered once in the backend sheet. Then, the dashboard automatically calculates KPIs, variances, and performance flags. Moreover, slicers allow instant filtering by year, month, region, product, sales rep, and status.
Consequently, insights update in real time without manual effort.
What Key KPIs Are Shown on the Main Dashboard?
Click to Buy Sales Performance Management Dashboard in Google Sheets
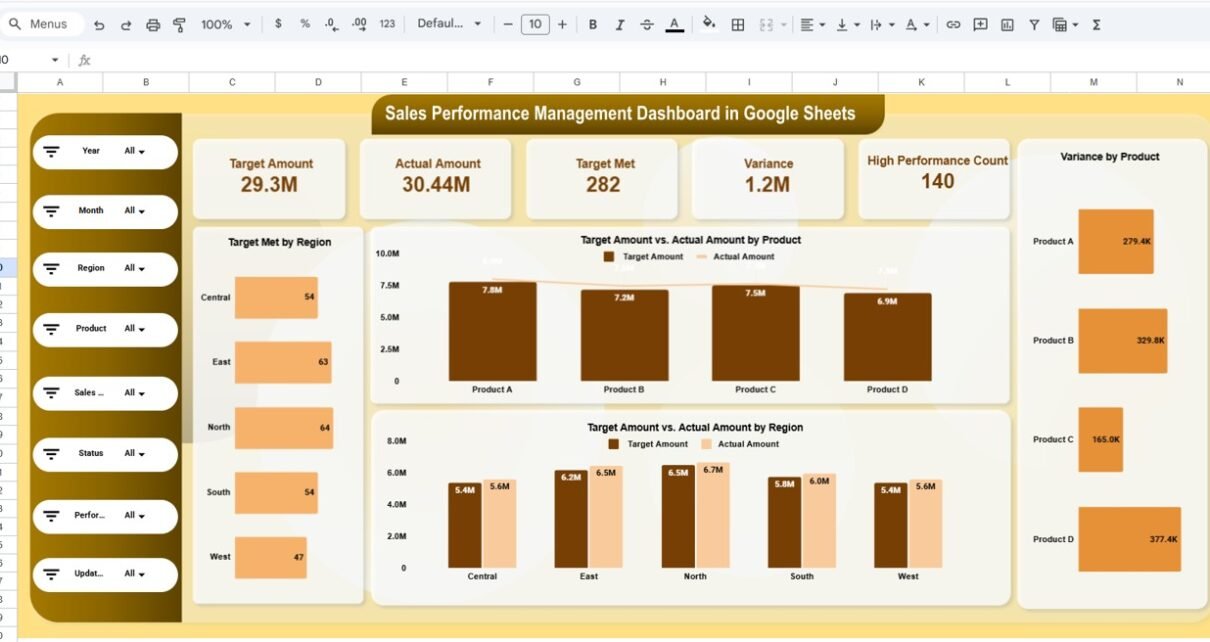
At the top of the dashboard, key KPI cards provide an instant performance snapshot:
-
Target Amount – Total sales target
-
Actual Amount – Total actual sales
-
Target Met Count – Number of achieved targets
-
Variance – Difference between target and actual
-
High Performance Count – Number of high-performing records
These KPIs help leadership quickly understand overall sales health.
What Is Shown on the Sales Performance Overview Page?
The Sales Performance Overview Page acts as the main landing page.
Key Visuals on This Page
- Target Met by Region
- Target Amount vs Actual Amount by Product
- Target Amount vs Actual Amount by Region
- Variance by Product
Available Filters
- Year
- Month
- Region
- Product
- Sales Rep
- Status
- Performance Flag
Because of these slicers, users can drill down into specific sales scenarios instantly.

Click to Buy Sales Performance Management Dashboard in Google Sheets
How Does the Product Analysis Page Help Sales Teams?
The Product Analysis Page focuses on product-wise performance.
Key Insights from Product Analysis
- Target Met vs Not Achieved by Product
- Target vs Actual Sales by Product
- Variance by Product
- Below Target vs Above Target Count
This page helps organizations identify:
- Best-selling products
- Products missing targets
- Revenue contribution by product
As a result, sales strategies become more focused and effective.

Click to Buy Sales Performance Management Dashboard in Google Sheets
What Insights Does the Region Analysis Page Provide?
The Region Analysis Page analyzes sales performance geographically.
Key Metrics on Region Analysis
- Target Met vs Not Achieved by Region
- Target vs Actual Sales by Region
- Variance by Region
- Below Target vs Above Target Count by Region
This view helps management understand which regions drive growth and which regions need corrective actions.

Click to Buy Sales Performance Management Dashboard in Google Sheets
How Does the Sales Rep Analysis Page Improve Accountability?
The Sales Rep Analysis Page tracks individual salesperson performance.
Insights Available on This Page
- Target Met vs Not Achieved by Sales Rep
- Target vs Actual Sales by Sales Rep
- Variance by Sales Rep
- Below Target vs Above Target Count
Because of this transparency, managers can:
- Recognize top performers
- Support underperforming reps
- Design incentive and training plans

Click to Buy Sales Performance Management Dashboard in Google Sheets
Why Is the Monthly Trends Page Important?
The Monthly Trends Page highlights time-based sales behavior.
Monthly Metrics Tracked
- Target Met vs Not Achieved by Month
- Target vs Actual Sales by Month
- Variance by Month
- Below Target vs Above Target Count
This page helps businesses:
- Identify seasonal patterns
- Track performance improvement over time
- Align forecasting with historical data

What Is the Search and Detailed Records Page?
Click to Buy Sales Performance Management Dashboard in Google Sheets
The Search by Keyword and Field Page provides transaction-level visibility.
Features of This Page
-
Search by selected column
-
Keyword-based filtering
-
Detailed sales records view
-
Performance flag and status tracking
This page supports audits, validations, and detailed sales reviews.

Click to Buy Sales Performance Management Dashboard in Google Sheets
How Is Sales Data Structured in the Dashboard?
The underlying data typically includes:
- Date
- Region
- Sales Rep
- Product
- Target Amount
- Actual Amount
- Variance
- Status (Achieved / Not Achieved)
- Performance Flag
- Updated By
- Updated On
Because data remains structured, reporting stays accurate and consistent.
Advantages of Sales Performance Management Dashboard in Google Sheets
Click to Buy Sales Performance Management Dashboard in Google Sheets
1. Improves Sales Visibility
All sales KPIs appear in one centralized view.
2. Enhances Decision-Making
Target vs actual comparisons highlight gaps quickly.
3. Increases Sales Accountability
Individual and regional performance becomes transparent.
4. Saves Time
Automated calculations eliminate manual reporting.
5. Encourages Collaboration
Google Sheets supports real-time team collaboration.
6. Cost-Effective Solution
No expensive BI tools required.
How Does This Dashboard Support Sales Leadership?
Sales leaders gain instant insights into performance trends, target achievement, and variance. As a result, they take faster actions, adjust strategies, and improve revenue outcomes.
Best Practices for Using a Sales Performance Management Dashboard
Click to Buy Sales Performance Management Dashboard in Google Sheets
1. Maintain Clean Sales Data
Ensure accurate entry of targets and actuals.
2. Review Performance Regularly
Analyze weekly, monthly, and quarterly trends.
3. Use Performance Flags Correctly
Ensure high-performance logic stays consistent.
4. Leverage Filters During Reviews
Use slicers during leadership and pipeline meetings.
5. Protect Data Integrity
Restrict editing access for critical formulas.
Who Should Use This Dashboard?
Click to Buy Sales Performance Management Dashboard in Google Sheets
This dashboard benefits:
- Sales Managers
- Sales Operations Teams
- Business Leaders
- Revenue Analysts
- Strategy Teams
Because Google Sheets is familiar, adoption remains smooth.
Conclusion
A Sales Performance Management Dashboard in Google Sheets transforms raw sales data into actionable insights. It improves visibility, accountability, and strategic decision-making across sales teams.
With product, region, sales rep, and monthly analysis, this dashboard enables organizations to move toward data-driven sales performance management.
Frequently Asked Questions (FAQs)
Click to Buy Sales Performance Management Dashboard in Google Sheets
What is a Sales Performance Management Dashboard?
It is a Google Sheets-based dashboard that tracks sales targets, actuals, variance, and performance.
Can I customize this dashboard?
Yes, you can easily add products, regions, or KPIs.
Does this dashboard support monthly and yearly analysis?
Yes, it supports both time-based views.
Is Google Sheets suitable for sales dashboards?
Yes, it supports automation, collaboration, and advanced visuals.
Who should maintain this dashboard?
Sales operations or analytics teams should maintain and review it regularly.
Visit our YouTube channel to learn step-by-step video tutorials
Youtube.com/@NeotechNavigators
Watch the step-by-step video tutorial:
Click to Buy Sales Performance Management Dashboard in Google Sheets