Managing employee leave efficiently plays a critical role in workforce productivity, cost control, and employee satisfaction. However, when leave data remains scattered across registers or raw spreadsheets, decision-making becomes slow and reactive. That is exactly why the Leave Performance Analytics Dashboard in Google Sheets becomes an essential solution.
In this article, we explain the Leave Performance Analytics Dashboard in Google Sheets, how it works, and how organizations can use it as a ready-to-use analytics dashboard to monitor leave trends, costs, and employee behavior in real time.
What Is a Leave Performance Analytics Dashboard in Google Sheets?
Click to Buy Leave Performance Analytics Dashboard in Google Sheets
A Leave Performance Analytics Dashboard in Google Sheets is an interactive reporting solution designed to analyze employee leave data in a structured and visual manner.
Instead of manually reviewing leave records, HR teams and managers can instantly:
- Track total leaves taken
- Monitor unplanned leaves
- Analyze leave costs
- Measure average leave duration
- Identify department-wise and reason-wise trends
- Detect seasonal and monthly leave patterns
Because the dashboard is built in Google Sheets, it remains cloud-based, collaborative, and easy to update.
Why Use a Leave Performance Analytics Dashboard?
Click to Buy Leave Performance Analytics Dashboard in Google Sheets
Organizations face several challenges in leave management. However, this dashboard solves them effectively.
Key reasons to use this dashboard:
- Improves visibility into leave patterns
- Reduces unplanned leave impact
- Controls leave-related costs
- Supports fair workload distribution
- Enables data-driven HR decisions
As a result, HR teams move from guesswork to insight-driven workforce planning.
Overview of the Leave Performance Analytics Dashboard
This ready-to-use dashboard consists of multiple analytical pages, each focused on a specific dimension of leave data. Moreover, dynamic slicers allow users to filter data by Month, Department, Leave Type, Approval Status, and Reason.
Let us explore each dashboard page in detail.
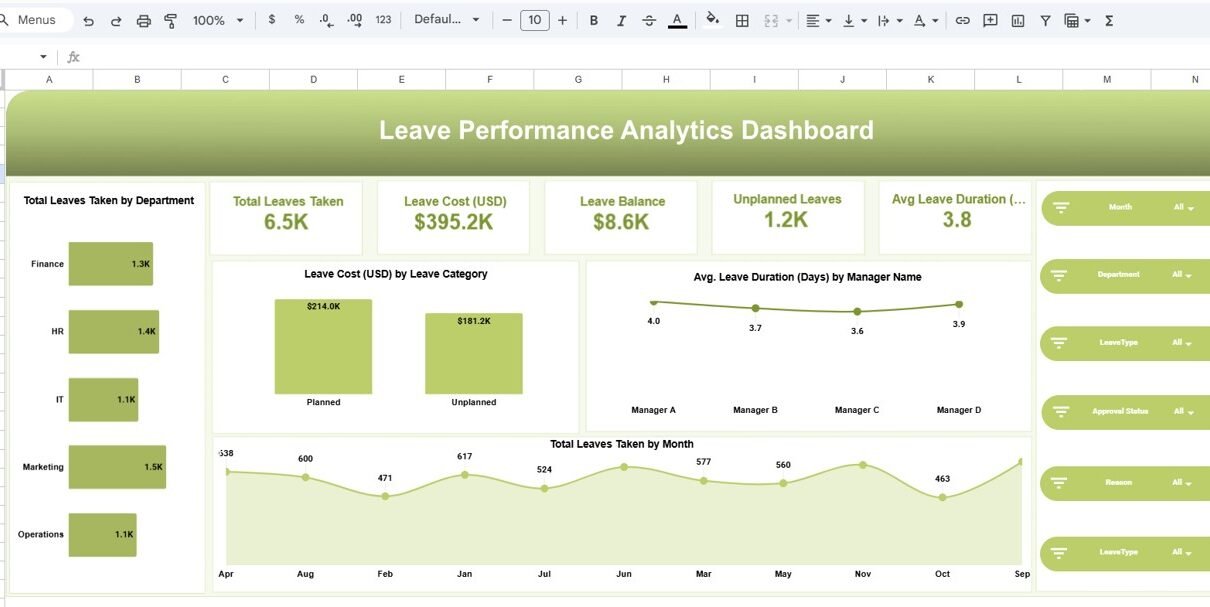
Leave Performance Analytics Dashboard: Summary View
The Leave Performance Analytics Dashboard provides a high-level snapshot of overall leave activity.
Key KPI Cards Displayed:
- Total Leaves Taken
- Leave Cost (USD)
- Leave Balance
- Unplanned Leaves
- Average Leave Duration (Days)
Because these KPIs update dynamically based on slicer selections, managers can quickly understand workforce availability and cost impact.

Click to Buy Leave Performance Analytics Dashboard in Google Sheets
Leave Performance Analysis by Leave Type
This page focuses on leave category insights.
Insights Covered:
- Total leaves taken by leave type
- Unplanned leaves by leave type
- Average leave duration by leave type
- Leave cost by leave type
Common Leave Types Analyzed:
- Casual Leave
- Earned Leave
- Maternity Leave
- Paternity Leave
- Sick Leave
As a result, HR teams can identify which leave types create the highest operational impact.

Click to Buy Leave Performance Analytics Dashboard in Google Sheets
Department Analysis: How Do Departments Compare?
The Department Analysis page highlights leave behavior across departments.
Key Metrics:
- Total leaves taken by department
- Average leave duration by department
- Leave cost by department
- Unplanned leaves by department
Because this view compares departments side by side, management can detect workload imbalance and staffing risks early.

Click to Buy Leave Performance Analytics Dashboard in Google Sheets
Reason Analysis: Why Are Employees Taking Leaves?
Understanding leave reasons helps organizations address root causes.
This page shows:
- Total leaves taken by reason
- Average leave duration by reason
- Unplanned leaves by reason
- Leave cost by reason
Common Reasons Tracked:
- Medical
- Personal Work
- Family Events
- Travel
- Vacation
As a result, HR teams can introduce targeted policies and wellness programs.

Click to Buy Leave Performance Analytics Dashboard in Google Sheets
Monthly Trends: How Do Leave Patterns Change Over Time?
The Monthly Trends page reveals seasonal and time-based patterns.
Monthly insights include:
- Total leaves taken by month
- Average leave duration by month
- Unplanned leaves by month
- Leave cost by month
Because trends become visible instantly, planning becomes proactive instead of reactive.

Click to Buy Leave Performance Analytics Dashboard in Google Sheets
Detailed Leave Data Table
The dashboard connects to a detailed leave data table, which acts as the backend data source.
Data fields include:
- Employee Name
- Department
- Leave Type
- Leave Start Date & End Date
- Days Requested
- Approval Status
- Reason
- Leave Balance
- Total Leaves Taken
- Unplanned Leaves
- Average Leave Duration
- Leave Cost
- Approval Indicator
Because the data table remains structured, the dashboard stays accurate and reliable.

Click to Buy Leave Performance Analytics Dashboard in Google Sheets
Key Advantages of Leave Performance Analytics Dashboard in Google Sheets
Centralized Leave Monitoring
All leave data stays in one interactive dashboard.
Real-Time Filtering
Dynamic slicers allow instant analysis by multiple dimensions.
Cost Visibility
Organizations clearly see the financial impact of leaves.
Improved Workforce Planning
Managers can plan staffing based on trends.
Cloud-Based Collaboration
Google Sheets allows real-time access and sharing.
Ready-to-Use Design
No complex setup or technical expertise required.
Best Practices for Using Leave Performance Analytics Dashboard
Click to Buy Leave Performance Analytics Dashboard in Google Sheets
To maximize value, follow these best practices:
- Update leave data regularly
- Maintain consistent leave categories
- Validate approval status accurately
- Review unplanned leaves monthly
- Monitor leave cost trends
- Use department insights for capacity planning
By following these practices, organizations maintain long-term dashboard accuracy.
Who Can Use This Dashboard?
This dashboard suits multiple roles:
- HR Managers
- HR Analysts
- Operations Managers
- Department Heads
- Business Owners
- Workforce Planning Teams
Because the dashboard remains intuitive, even non-technical users can use it confidently.
Conclusion: Why Choose a Leave Performance Analytics Dashboard in Google
Sheets?
Click to Buy Leave Performance Analytics Dashboard in Google Sheets
The Leave Performance Analytics Dashboard in Google Sheets transforms raw leave records into actionable workforce insights. It helps organizations control costs, reduce unplanned leaves, and improve employee planning.
Visit our YouTube channel to learn step-by-step video tutorials
Youtube.com/@NeotechNavigators
Watch the step-by-step video tutorial:
Click to Buy Leave Performance Analytics Dashboard in Google Sheets