Scientific research organizations thrive on data-driven insights. Measuring the right performance metrics helps research institutions, laboratories, and universities monitor progress, improve efficiency, and maintain high-quality outcomes.Scientific Research KPI Dashboard in Google Sheets
The Scientific Research KPI Dashboard in Google Sheets is a powerful, ready-to-use solution designed to track all essential Key Performance Indicators (KPIs) related to scientific research projects. It provides a complete, interactive view of operational performance — from publication output to grant utilization — all in one place.Scientific Research KPI Dashboard in Google Sheets
What Is a Scientific Research KPI Dashboard in Google Sheets?
Click to Buy Scientific Research KPI Dashboard in Google Sheets
A Scientific Research KPI Dashboard is a data analytics tool that helps research departments monitor project progress, publication performance, funding efficiency, and team productivity.Scientific Research KPI Dashboard in Google Sheets
Built entirely in Google Sheets, this dashboard tracks both monthly (MTD) and year-to-date (YTD) performance across multiple research indicators. It includes interactive dropdowns, traffic light indicators, and conditional arrows to show improvement or decline, making it easy to interpret results at a glance.Scientific Research KPI Dashboard in Google Sheets
Dashboard Structure Overview
This KPI Dashboard consists of six key worksheets, each serving a specific purpose:
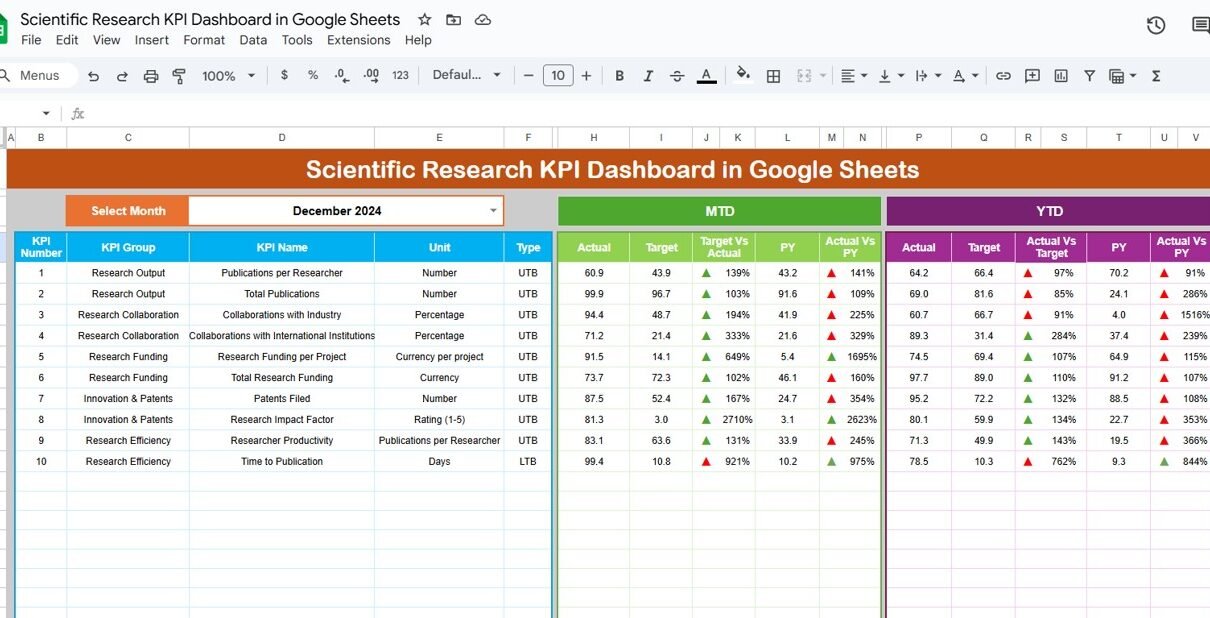
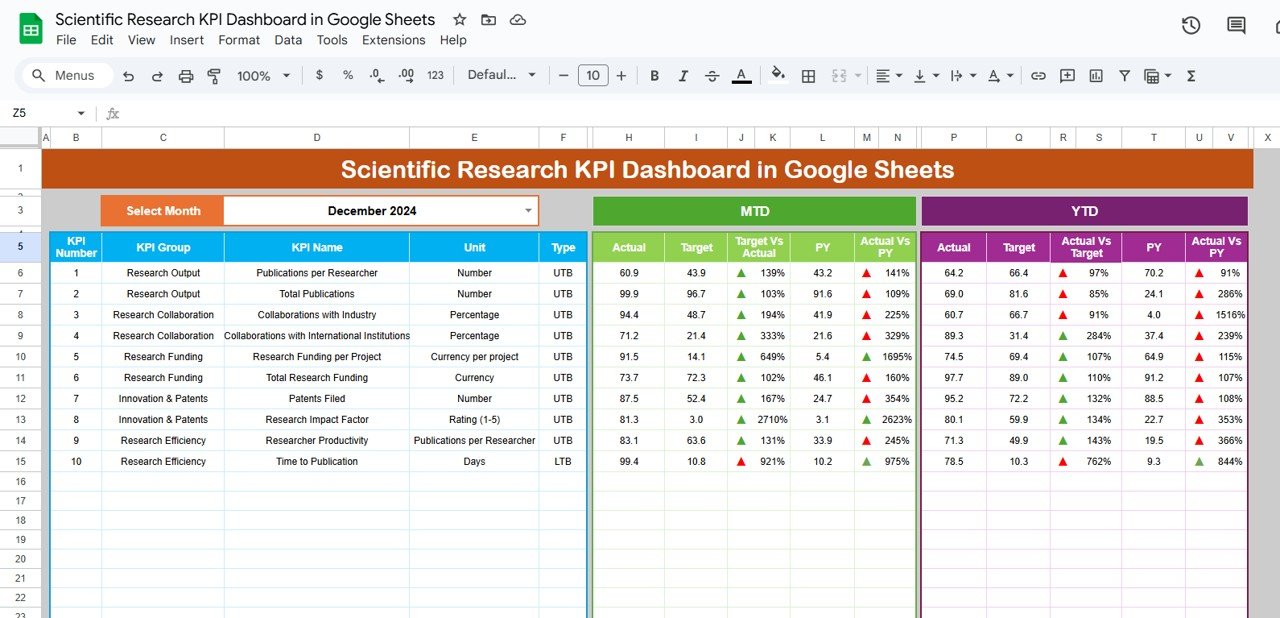
Dashboard Sheet Tab
This is the main sheet of the dashboard — where all performance information is displayed.
You can select any month from the dropdown in cell D3, and the entire dashboard updates automatically.
Displays both MTD (Month-To-Date) and YTD (Year-To-Date) performance data.
Compares Actual vs Target and Actual vs Previous Year (PY) values.
Uses conditional formatting with traffic light indicators and up/down arrows to highlight performance trends.
Click to Buy Scientific Research KPI Dashboard in Google Sheets
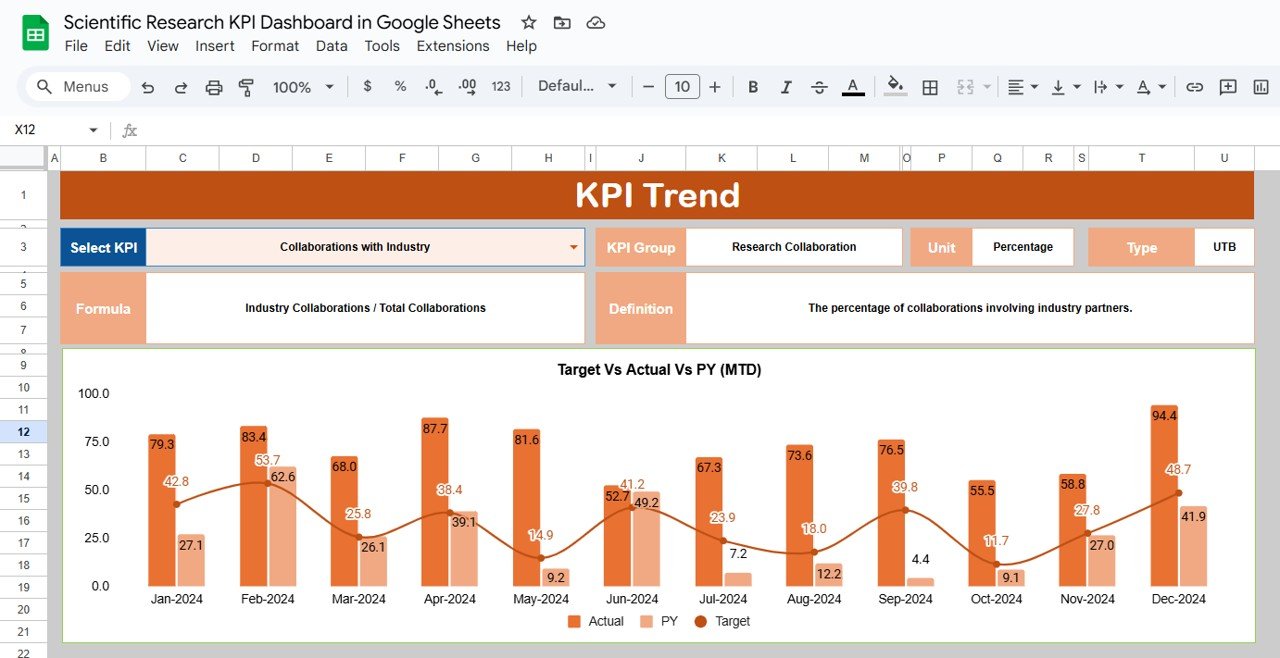
KPI Trend Sheet Tab
This tab helps analyze trends for any individual KPI.
Select the KPI name from the dropdown in cell C3.
The dashboard automatically displays:
- KPI Group
- KPI Unit
- KPI Type (LTB / UTB)
- Formula
- Definition
- Monthly trend chart (MTD or YTD)
This sheet is crucial for identifying performance patterns and forecasting research productivity.
Click to Buy Scientific Research KPI Dashboard in Google Sheets
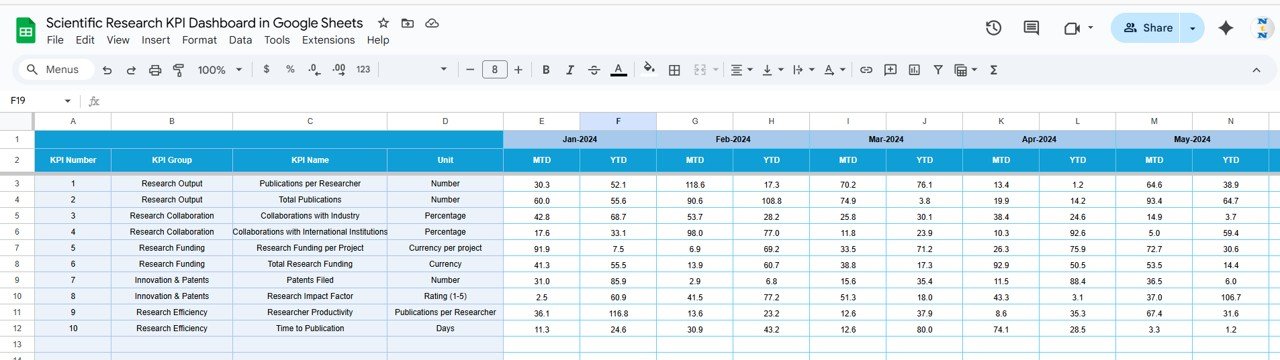
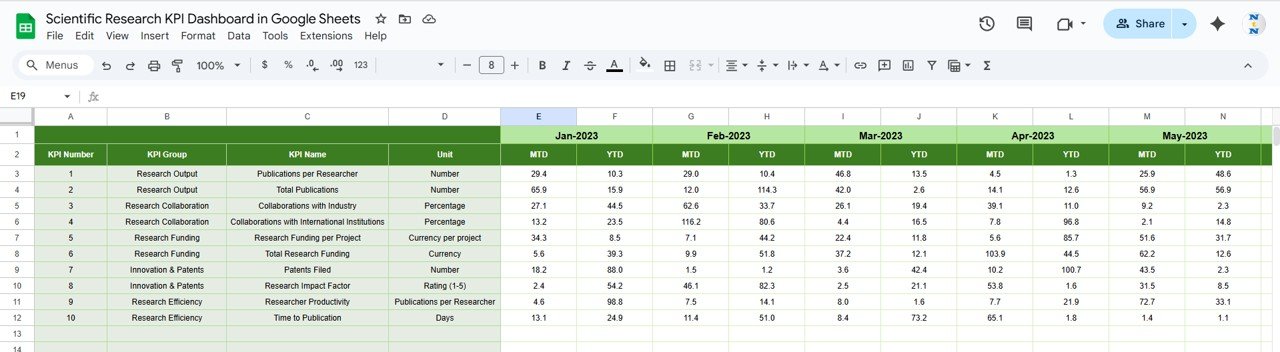
Actual Numbers Sheet Tab
This sheet is where you input all Actual values for KPIs.
-
Update monthly values in both MTD and YTD formats.
-
The month selector (cell E1) helps control which month’s data feeds into the dashboard.
-
Each entry automatically refreshes dashboard calculations.
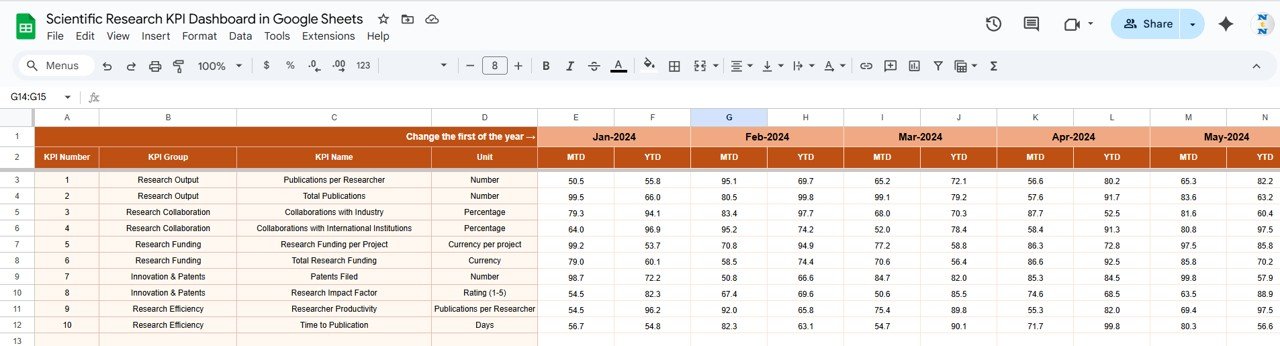
Target Sheet Tab
In this sheet, users define the target values for each KPI by month — for both MTD and YTD.
-
Helps set measurable goals and compare them against performance data.
-
Targets can vary by research project, department, or time period.
Click to Buy Scientific Research KPI Dashboard in Google Sheets
Previous Year Numbers Sheet Tab
This sheet stores the previous year’s KPI data, which allows for performance comparison and growth evaluation.
-
Enter monthly values in the same format as current year data.
-
The dashboard automatically computes PY vs Actual variance.
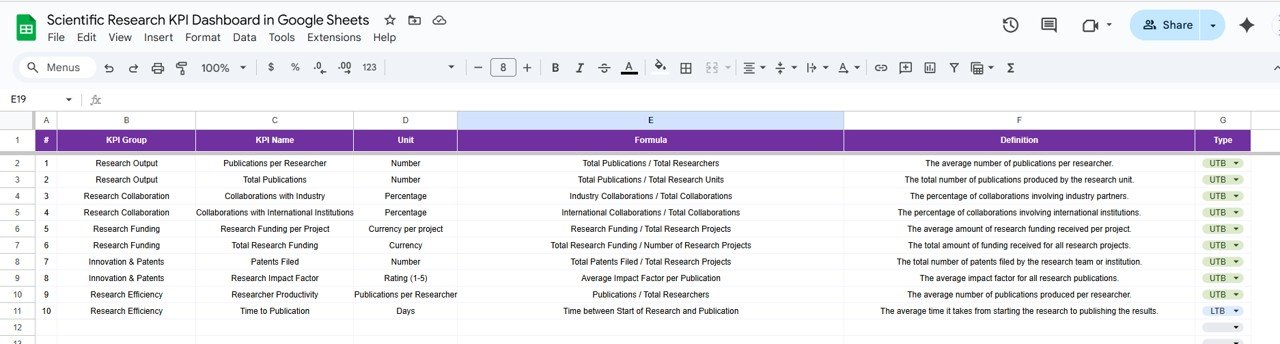
KPI Definition Sheet Tab
This is the foundation of the dashboard where all KPI details are documented.
It includes columns for:
- KPI Group
- KPI Name
- Unit
- Formula
- Definition
- Type (LTB = Lower the Better / UTB = Upper the Better)
Click to Buy Scientific Research KPI Dashboard in Google Sheets
Advantages of the Scientific Research KPI Dashboard
-
Centralized Research Performance Tracking: All research metrics available in one place.
-
Interactive & Visual: Real-time updates with dropdown selections and automated indicators.
-
Improved Transparency: Easily compare Actual vs Target vs Previous Year values.
-
Performance Insights: Identify top-performing departments or researchers.
-
Customizable & Shareable: Built in Google Sheets for easy collaboration.
-
KPI Standardization: Ensures consistent data collection and reporting across research teams.
Opportunities for Improvement
Even though the dashboard is robust, a few enhancements can make it even better:
-
Automation: Connect to Google Forms or databases for real-time data collection.
-
Visualization Upgrade: Integrate with Google Looker Studio for richer visual analytics.
-
Auto Email Alerts: Send renewal or review reminders using Google Apps Script.
-
Monthly Summary Report: Generate PDF summaries automatically for management.
-
Researcher-Level Drill-Down: Add filters for department or researcher view.
Best Practices for Using the Dashboard
Click to Buy Scientific Research KPI Dashboard in Google Sheets
-
Update Monthly: Keep Actual, Target, and Previous Year sheets up-to-date.
-
Review KPI Definitions Regularly: Ensure metrics stay relevant to current goals.
-
Set SMART Targets: Specific, Measurable, Achievable, Relevant, Time-bound.
-
Use Trend Sheet Analysis: Spot seasonal trends or recurring issues.
-
Promote Data Consistency: Standardize entry formats (dates, units, decimals).
-
Secure Sensitive Data: Restrict edit access for key financial or research data.
-
Encourage Departmental Review: Share the dashboard with research leads monthly.
Example Dashboard Insight
Imagine the Scientific Research Department at a university using this dashboard:
-
Grant Utilization Rate: 92% (↑ from 87% last year)
-
Number of Papers Published: 135 (↑ 15% YoY)
-
Project Delay Rate: 8% (↓ from 11% last year)
-
Patent Approval Rate: 67% (↑ from 60% last year)
Such insights help leadership evaluate the effectiveness of funding, collaboration, and research output instantly.
Conclusion
Click to Buy Scientific Research KPI Dashboard in Google Sheets
The Scientific Research KPI Dashboard in Google Sheets is a comprehensive, flexible, and intuitive tool that empowers research institutions to monitor and optimize performance. It simplifies complex data into visual insights — helping teams make informed decisions, allocate resources effectively, and drive scientific excellence.
Whether you’re managing a research institute, a university lab, or an R&D division, this dashboard ensures full visibility into every KPI that matters.
Frequently Asked Questions (FAQ)
1. Can I customize the KPIs?
Yes. You can add, remove, or modify KPIs in the KPI Definition Sheet based on your institution’s focus areas.
2. Can I analyze performance by department or researcher?
Yes. By adding filters or pivot tables, you can view department- or researcher-specific performance.
3. Does the dashboard update automatically?
Yes. Once Actual and Target data are updated, all charts and traffic lights refresh instantly.
4. Can I use this dashboard for grant or project tracking only?
Absolutely. You can adapt the KPIs to focus solely on funding, timelines, or project efficiency.
5. Is the dashboard shareable?
Yes. Since it’s built in Google Sheets, it supports real-time collaboration and cloud access.
Visit our YouTube channel to learn step-by-step video tutorials
Youtube.com/@NeotechNavigators
Click to Buy Scientific Research KPI Dashboard in Google Sheets