Seasonal sales strongly influence revenue, inventory planning, marketing campaigns, and staffing decisions. During peak seasons, even small mistakes can lead to stock shortages or lost revenue. Meanwhile, during low seasons, poor planning can increase costs and reduce margins. Therefore, businesses must track seasonal sales performance accurately and consistently.
That is exactly why a Seasonal Sales KPI Dashboard in Google Sheets becomes an essential sales analytics tool.
This ready-to-use dashboard helps businesses monitor seasonal sales trends, compare performance against targets, and analyze year-over-year changes using clear KPIs. Moreover, it supports MTD and YTD tracking, target comparisons, and previous year analysis, all with visual indicators for faster decisions.
In this article, you will learn what this dashboard is, how it works, the KPIs it includes, its advantages, improvement opportunities, best practices, and frequently asked questions.
What Is a Seasonal Sales KPI Dashboard in Google Sheets?
Click to Buy Seasonal Sales KPI Dashboard in Google Sheets
A Seasonal Sales KPI Dashboard in Google Sheets is an interactive reporting tool designed to track and analyze sales performance across different seasons, months, and periods.
Instead of relying on static reports or manual calculations, this dashboard:
-
Centralizes all seasonal sales KPIs
-
Tracks Month-to-Date (MTD) and Year-to-Date (YTD) performance
-
Compares Actual vs Target values
-
Compares Current Year vs Previous Year
-
Highlights trends using conditional up/down arrows
Because the dashboard runs in Google Sheets, teams can collaborate in real time and update data easily.
Why Is Seasonal Sales Tracking Important?
Seasonal demand fluctuations affect revenue stability and operational efficiency. Therefore, tracking seasonal sales KPIs helps businesses:
-
Identify peak and off-peak seasons
-
Optimize inventory and supply chain planning
-
Improve promotional strategies
-
Set realistic sales targets
-
Increase overall profitability
As a result, businesses respond proactively instead of reacting too late.
Key Features of the Seasonal Sales KPI Dashboard
Click to Buy Seasonal Sales KPI Dashboard in Google Sheets
This dashboard follows a structured design that supports both strategic and operational analysis.
Key Highlights
-
Month selector for dynamic KPI updates
-
MTD and YTD sales tracking
-
Target vs Actual comparison
-
Previous Year performance comparison
-
Conditional formatting with up/down arrows
-
Dedicated KPI trend analysis
-
Separate data entry and KPI definition sheets
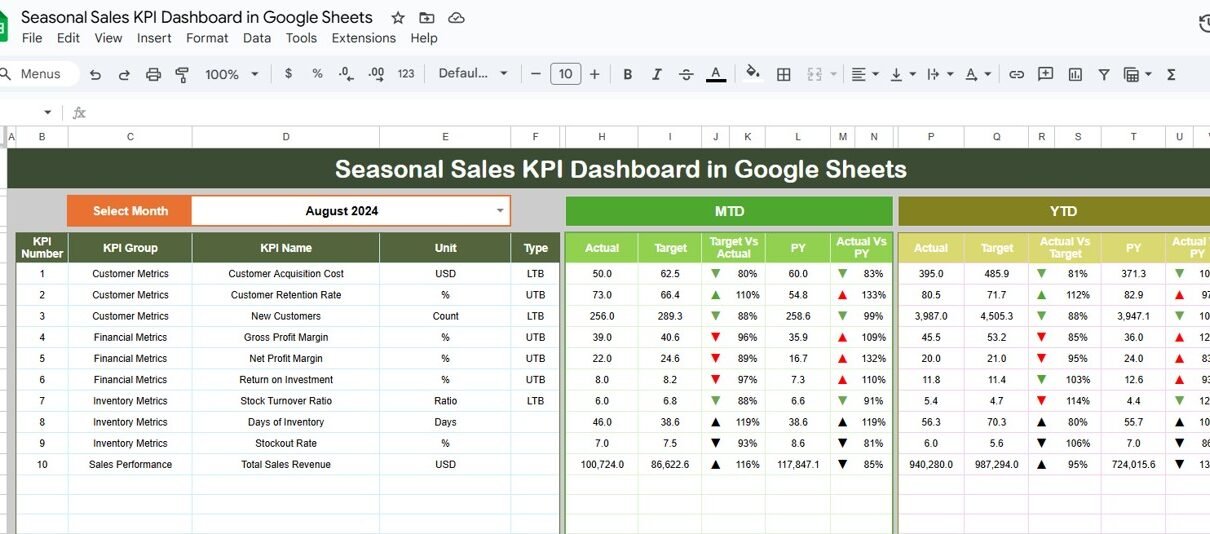
Dashboard Sheet Tab – Main KPI Overview
The Dashboard Sheet provides a high-level summary of seasonal sales performance.
Month Selection
-
Select the month from Cell D3
-
All KPIs update automatically based on the selected month
MTD KPIs Displayed
For each KPI, the dashboard shows:
-
MTD Actual
-
MTD Target
-
MTD Previous Year
-
Target vs Actual (%)
-
PY vs Actual (%)
Visual arrows quickly indicate whether performance improved or declined.
YTD KPIs Displayed
The dashboard also displays:
-
YTD Actual
-
YTD Target
-
YTD Previous Year
-
Target vs Actual (%)
-
PY vs Actual (%)
This view supports long-term seasonal sales analysis.

Click to Buy Seasonal Sales KPI Dashboard in Google Sheets
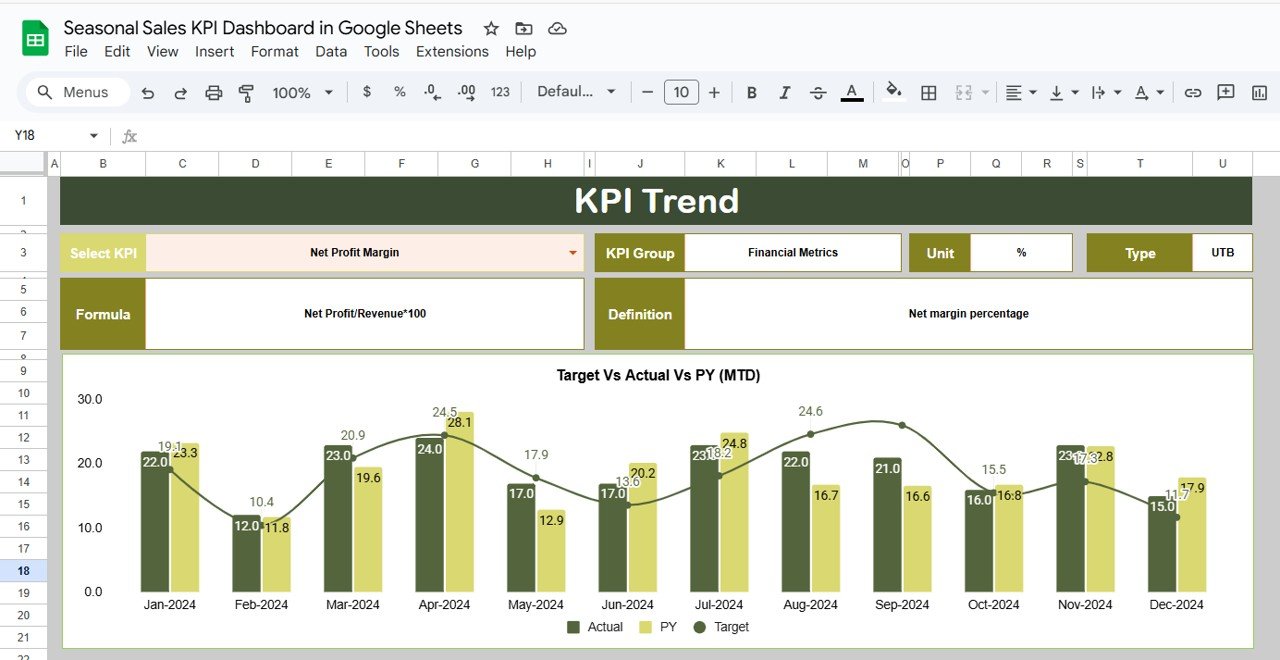
KPI Trend Sheet Tab – KPI Deep Dive
The KPI Trend Sheet explains each KPI in detail.
How It Works
-
Select a KPI name from the dropdown in Cell C3
-
The sheet dynamically updates KPI details
Displayed Information
-
KPI Group
-
KPI Unit
-
KPI Type (Lower the Better / Upper the Better)
-
KPI Formula
-
KPI Definition
This ensures consistent understanding across sales and management teams.
Click to Buy Seasonal Sales KPI Dashboard in Google Sheets
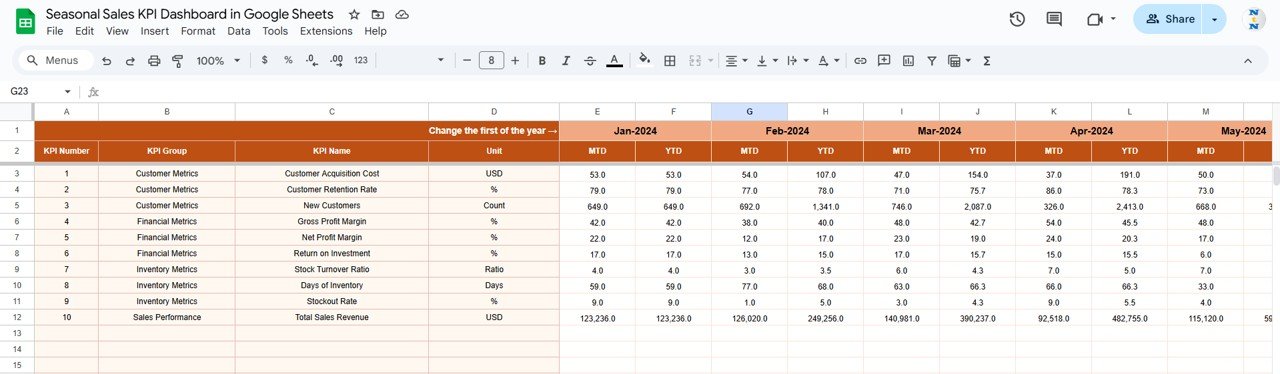
Actual Number Sheet Tab
This sheet stores real sales performance data.
How to Use
-
Enter the first month of the year in Cell E1
-
Input MTD Actual and YTD Actual values
-
The dashboard updates automatically
Target Sheet Tab
The Target Sheet defines expected seasonal performance.
Data Entry
-
Enter MTD Target values
-
Enter YTD Target values
Targets help teams measure success objectively.

Click to Buy Seasonal Sales KPI Dashboard in Google Sheets
Previous Year Number Sheet Tab
Historical data supports meaningful comparison.
Purpose
-
Enter previous year MTD and YTD values
-
Identify recurring seasonal patterns
-
Measure growth or decline trends

Click to Buy Seasonal Sales KPI Dashboard in Google Sheets
KPI Definition Sheet Tab – KPI Master
This sheet acts as the central KPI reference.
Fields Included
-
KPI Name
-
KPI Group
-
Unit
-
Formula
-
KPI Definition
-
KPI Type

Click to Buy Seasonal Sales KPI Dashboard in Google Sheets
Advantages of Seasonal Sales KPI Dashboard in Google Sheets
-
Centralized seasonal performance tracking
-
Faster trend identification
-
Improved sales forecasting
-
Better inventory and promotion planning
-
Clear target and year-over-year comparisons
-
Real-time collaboration
-
No expensive BI tools required
Opportunities for Improvement
Click to Buy Seasonal Sales KPI Dashboard in Google Sheets
Businesses can enhance this dashboard by:
-
Adding product or category-wise seasonal KPIs
-
Linking promotions to sales uplift
-
Integrating inventory cost analysis
-
Automating sales data import
-
Adding region-wise seasonal analysis
Best Practices for Using the Seasonal Sales Dashboard
-
Update sales data regularly
-
Review KPIs weekly during peak seasons
-
Compare Actual vs Target consistently
-
Monitor year-over-year trends closely
-
Align inventory and marketing decisions with insights
-
Share insights with sales and operations teams
Conclusion
Click to Buy Seasonal Sales KPI Dashboard in Google Sheets
A Seasonal Sales KPI Dashboard in Google Sheets transforms raw sales data into actionable insights. It helps businesses understand seasonal demand, improve planning accuracy, and maximize revenue during critical periods.
Because the dashboard is flexible, collaborative, and scalable, it becomes a powerful tool for retail, e-commerce, and distribution businesses.
Frequently Asked Questions (FAQs)
1. Who should use this dashboard?
Sales managers, business owners, marketing teams, and operations planners.
2. Can I customize KPIs and formulas?
Yes, all KPIs, formulas, and targets are fully customizable.
3. Does the dashboard support MTD and YTD tracking?
Yes, it supports both with historical comparisons.
4. Is Google Sheets secure for sales data?
Yes, with proper access permissions and sharing controls.
5. Can this dashboard scale for multi-store or multi-region businesses?
Yes, it works for small businesses and large enterprises.
Visit our YouTube channel to learn step-by-step video tutorials
Youtube.com/@NeotechNavigators
Watch the step-by-step video tutorial: