Small Business CFO Dashboard in Google Sheets is a powerful, ready-to-use financial management template designed for small business owners, startup founders, freelancers, and finance professionals. This Google Sheets dashboard template gives you a complete CFO-level view of your business finances — including revenue tracking, expense analysis, cash flow monitoring, and instant transaction lookup — all in one cloud-based file you can access from anywhere.Small Business CFO Dashboard in Google Sheets
If you have been struggling to keep track of your business finances using scattered spreadsheets or expensive accounting software, this dashboard simplifies everything. With 6 interactive pages and 5 key performance indicators, you get real-time financial insights without writing a single formula. Just enter your data, and the dashboard takes care of the rest.Small Business CFO Dashboard in Google Sheets
 Small Business CFO Dashboard in Google Sheets
Key Features of Small Business CFO Dashboard in Google Sheets
This template is packed with features that make financial tracking effortless for small businesses:
- 6 Interactive Dashboard Pages — Overview, Revenue, Expenses, Cash Flow, Search, and Data Sheet tabs covering every aspect of business finance.
- 5 CFO-Level KPI Cards — Total Revenue, Total Expenses, Net Profit, Profit Margin, and total Transactions displayed as high-visibility cards on the Overview page.
- Multiple Slicers and Filters — Filter the entire dashboard by department, category, payment method, or time period with a single click.
- Auto-Updating Charts and Formulas — All visuals refresh automatically as you enter or modify data in the Data sheet.
- Transaction Search Functionality — Look up any individual transaction by ID with complete details displayed instantly.
- Cloud-Based and Collaborative — Works on Google Drive, accessible from any device, and shareable with your team.
This is one of the most comprehensive Google Sheets dashboard templates available for small business financial management. It combines the simplicity of a spreadsheet with the analytical power of a dedicated CFO tool.
Dashboard Pages Explained
Click here to Purchase Small Business CFO Dashboard in Google Sheets
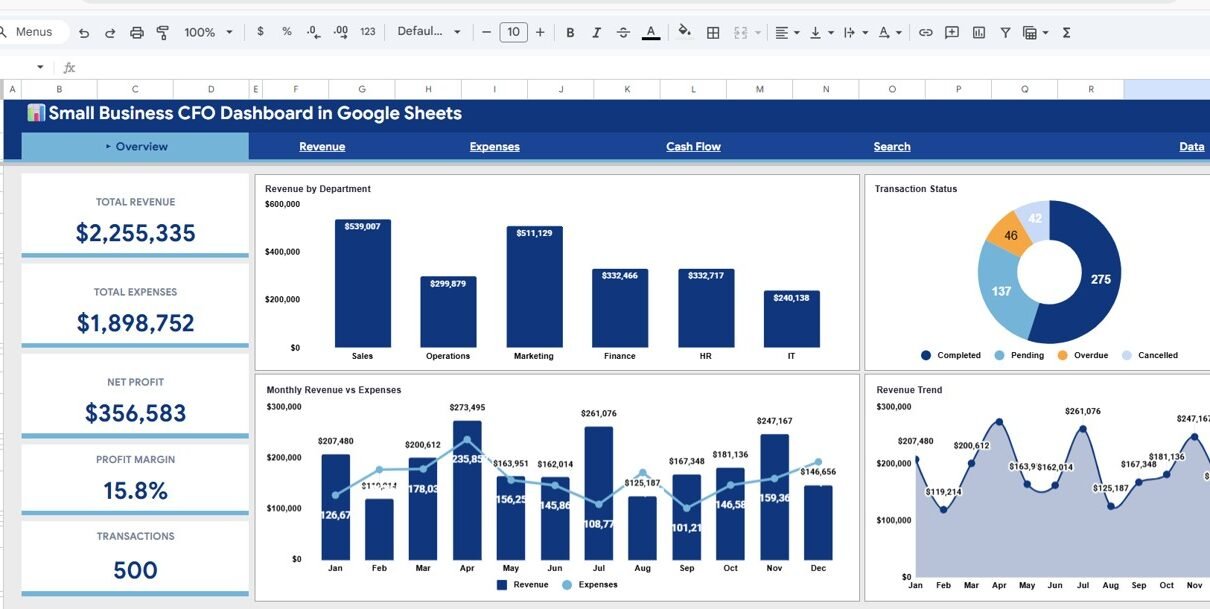
1. Overview Page
The Overview page serves as the main command center for your financial data. At the top, five KPI cards provide an instant snapshot of your business health: Total Revenue, Total Expenses, Net Profit, Profit Margin, and Transactions. These cards update in real time based on your data entries.
Below the KPI cards, you will find several analytical charts. Revenue by Department compares financial performance across different business units, helping you identify which departments are driving the most income. Monthly Revenue vs Expenses provides a side-by-side trend comparison so you can see how your spending aligns with your income over time. Transaction Status by Category breaks down your transactions by completion status — pending, completed, or cancelled — across different categories. Revenue Trend by Month reveals seasonal patterns and growth trajectories. Multiple slicers positioned on the page let you apply filters and see a customized view of the data instantly.
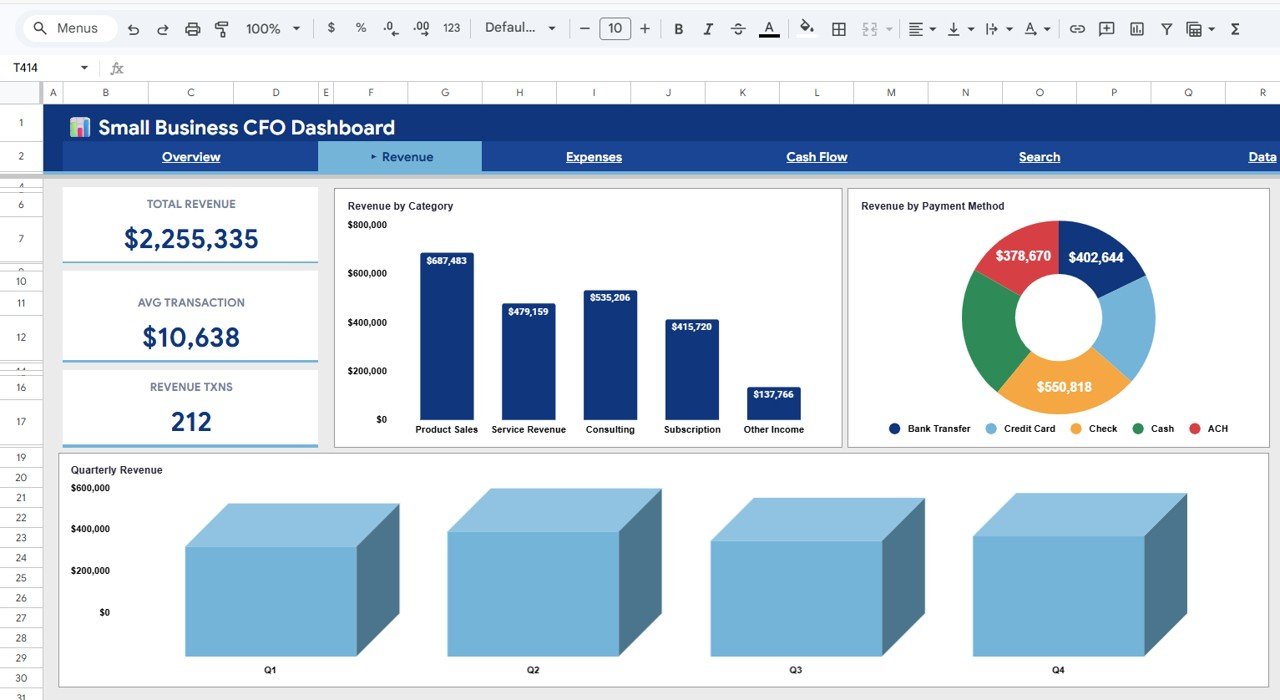
2. Revenue Page
The Revenue page dives deeper into your income streams. It features three focused analyses: Revenue by Category shows how different product lines, service types, or business segments contribute to your total revenue. Revenue by Payment Method reveals which payment channels — cash, credit card, bank transfer, or digital wallet — your customers prefer. Quarterly Revenue provides a time-based revenue breakdown that makes it easy to compare performance across quarters and plan ahead.
 Revenue Analysis Page
3. Expenses Page
The Expenses page gives you complete visibility into where your money is going. Expenses by Category breaks down spending into categories like operations, marketing, payroll, and utilities. Expenses by Department shows which teams or business units are consuming the most budget. Expense Distribution by Time reveals spending patterns over months, helping you identify trends, seasonal spikes, or areas where you can cut costs. Together, these three views give you everything you need to optimize your spending and protect your profit margins.
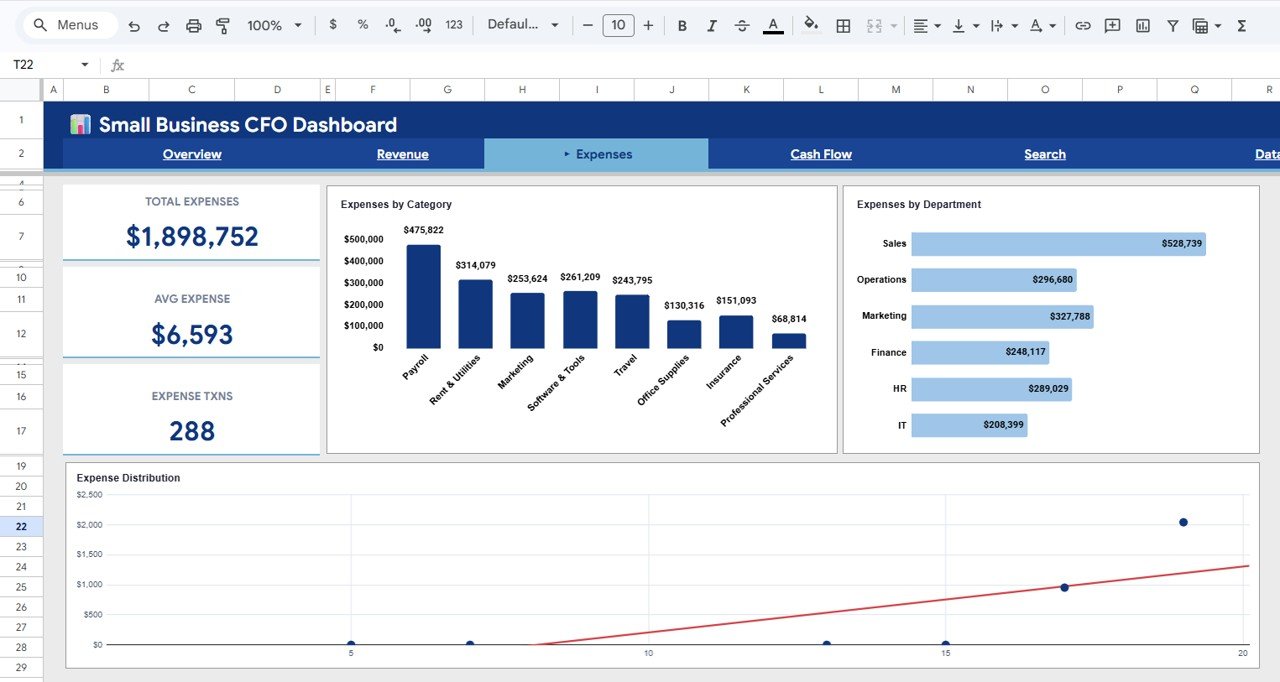 Expenses Analysis Page
4. Cash Flow Page
Cash flow is the lifeblood of any small business, and this page makes it easy to monitor. Cash by Account shows balances across different bank accounts or financial accounts. Cumulative Cash Flow by Month tracks the running total of your cash position over time — critical for spotting potential cash crunches before they happen. Monthly Inflow vs Outflow compares what comes in versus what goes out each month, giving you a clear picture of your burn rate and liquidity. If you want even more transaction-level detail, check out the Office Budget Utilization Dashboard in Google Sheets for related budget tracking capabilities.
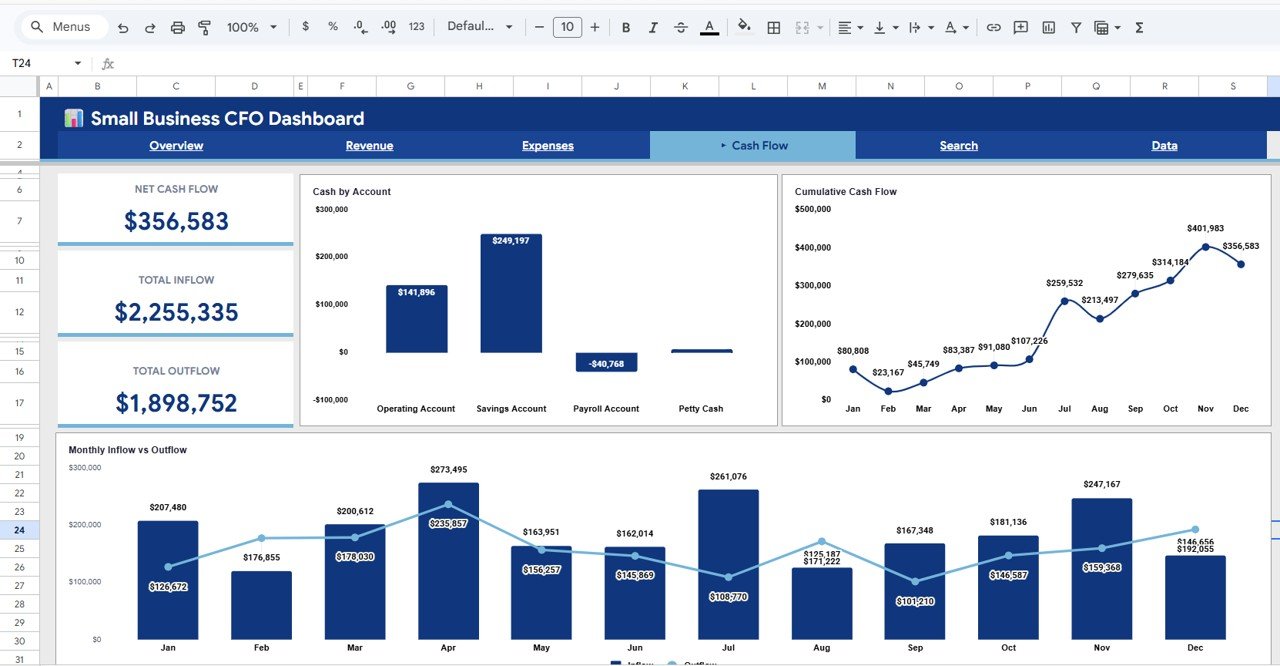 Cash Flow Analysis Page
5. Search Page
The Search page is a quick-lookup tool that lets you find any transaction by selecting a Transaction ID from a dropdown menu. Once selected, the page displays all relevant details including Date, Category, Sub-Category, Department, Type, Revenue, Expense, Profit, Payment Method, Vendor or Customer, Status, and Account. This is extremely useful for auditing, reconciliation, or answering specific questions about individual transactions.
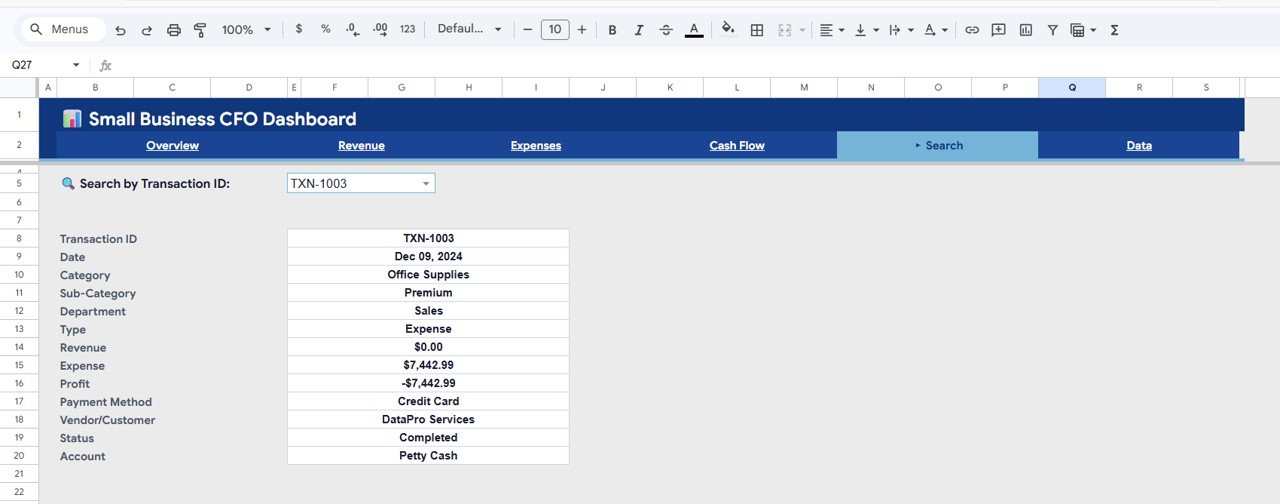 Search Sheet Tab
6. Data Sheet Tab
The Data sheet is where you input all your financial transactions. It follows a structured format with columns for every data point the dashboard needs. Simply replace the sample data with your own transactions in the same format, and all five dashboard pages will update automatically. No need to touch any formulas, create any charts, or configure any settings — it just works.
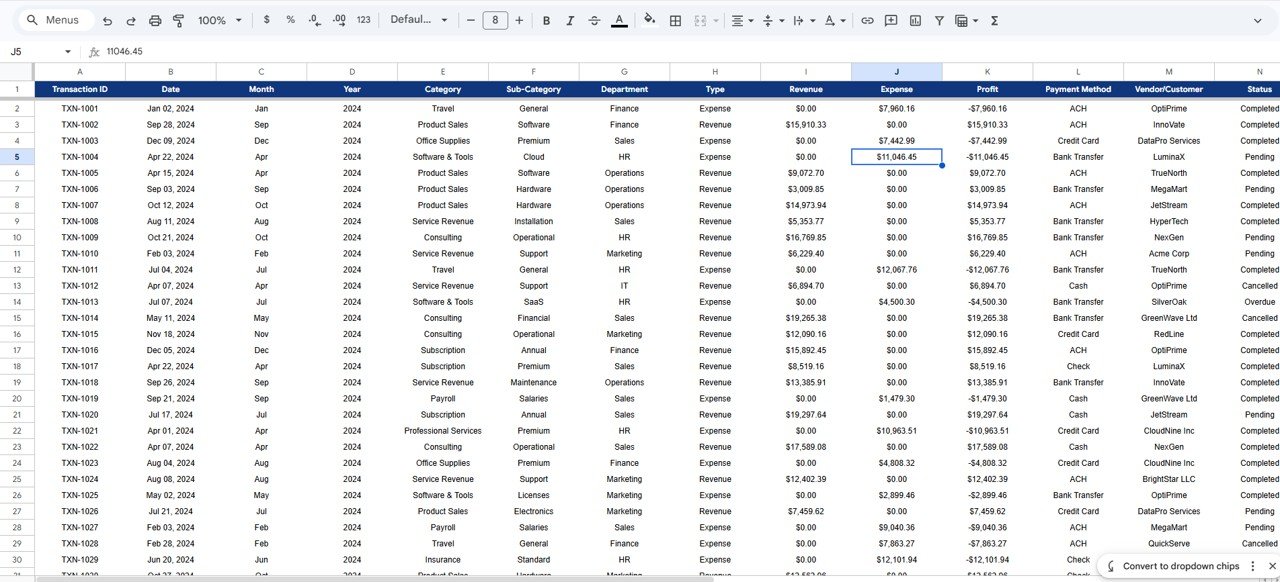 Data Sheet Tab
Advantages of Small Business CFO Dashboard in Google Sheets
Click here to Purchase Small Business CFO Dashboard in Google Sheets
- Zero Setup Time — The dashboard is ready to use immediately. Just make a copy, enter your data, and you have a working financial dashboard.
- No Software Installation — It runs entirely in Google Sheets, so there is nothing to install, no licenses to purchase, and no compatibility issues.
- Cost-Effective — At a fraction of the cost of accounting software or hiring a financial analyst, you get a professional-grade dashboard.
- Fully Customizable — Since it is built in Google Sheets, you can modify formulas, add new charts, or adjust the layout to fit your specific needs.
- Team Collaboration — Share the file with your accountant, business partner, or team members and work on it simultaneously in real time.
- Multi-Platform Access — Access your financial dashboard from your laptop, tablet, or phone through Google Drive.
For those who prefer Microsoft Excel, the Small Business CFO Dashboard in Excel offers a similar experience with pivot tables and advanced Excel charting. You can also explore the Small Business CFO Dashboard in HTML for an interactive browser-based version.
Opportunities for Improvement
While this dashboard covers the core financial tracking needs of most small businesses, there are a few areas where users might want to expand:
- Budget vs Actual Comparison — Adding a budgeting layer would let users compare planned spending against actual expenses for tighter financial control.
- Forecasting — Incorporating trend-based revenue and expense forecasting could help business owners plan ahead with greater confidence.
- Multi-Currency Support — For businesses operating internationally, adding currency conversion formulas would extend the dashboard’s utility.
- Automated Data Import — Connecting the Data sheet to bank feeds or accounting tools via Google Sheets integrations could reduce manual entry.
Best Practices for Using This Dashboard
Click here to Purchase Small Business CFO Dashboard in Google Sheets
- Update Data Weekly — For the most accurate insights, enter your financial transactions at least once a week. Monthly entries work but may miss short-term trends.
- Keep the Data Format Consistent — Do not add extra columns or change column headers in the Data sheet. The dashboard formulas rely on the existing structure.
- Use the Slicers — The Overview page slicers are powerful. Use them to create focused views for specific departments, categories, or time periods during financial reviews.
- Share Read-Only Copies — When sharing with stakeholders who should not edit the data, use Google Sheets’ sharing settings to grant view-only access.
- Create Monthly Snapshots — Duplicate the file at the end of each month to preserve a historical record of your financial data and dashboard state.
For additional financial tracking capabilities, explore the Accounts Payable KPI Dashboard in Google Sheets and the Financial Risk KPI Dashboard in Google Sheets.
Explore Relevant Templates
- Small Business CFO Dashboard in Power BI — Advanced interactive analytics with drill-through and DAX-powered measures.
- Finance & Accounting Command Center Bundle — 8 premium finance templates in one bundle across Excel, Power BI, and Google Sheets.
- Financial Transactions Dashboard in Google Sheets — Detailed transaction-level reporting and analysis.
- Small Business CFO Dashboard in HTML — Browser-based interactive version with modern UI.
Frequently Asked Questions
Click here to Purchase Small Business CFO Dashboard in Google Sheets
What KPIs does the Small Business CFO Dashboard in Google Sheets track?
The Small Business CFO Dashboard in Google Sheets tracks 5 key performance indicators: Total Revenue, Total Expenses, Net Profit, Profit Margin, and total Transactions. These are displayed as cards on the Overview page and update automatically when you enter data in the Data sheet.
Do I need advanced Google Sheets skills to use this dashboard?
No. The dashboard is fully formula-driven. You only need to replace the sample data in the Data sheet with your own financial transactions. All 6 pages — including charts, KPI cards, and the search function — update automatically.
Can I filter the dashboard by department or time period?
Yes. The Overview page includes multiple slicers that let you filter the entire dashboard by department, category, payment method, and time period with a single click. This makes it easy to create focused views for meetings or reports.
What is the best Google Sheets template for small business financial tracking?
The Small Business CFO Dashboard in Google Sheets from NextGenTemplates is one of the best available options. It covers revenue, expenses, cash flow, and transaction search across 6 interactive pages — all in a single Google Sheets file that requires no setup.
How do I track cash flow in Google Sheets?
The Cash Flow page in this dashboard provides three key views: Cash by Account, Cumulative Cash Flow by Month, and Monthly Inflow vs Outflow. Simply enter your income and expense transactions in the Data sheet and the cash flow analysis populates automatically.
Is this dashboard suitable for multiple businesses?
Yes. You can create independent copies for each business using the Google Sheets copy link in the PDF guide. Each copy maintains its own data and analysis, fully separate from the others.
Conclusion
The Small Business CFO Dashboard in Google Sheets is a must-have tool for any small business owner, freelancer, or finance professional who wants clear, real-time visibility into their financial performance. With 6 interactive pages, 5 KPI cards, multiple slicers, and a powerful search function, this dashboard transforms raw financial data into actionable insights — without requiring any technical skills or expensive software.
Click here to Purchase Small Business CFO Dashboard in Google Sheets
Visit our YouTube channel for step-by-step video tutorials: