This ready-to-use template helps you monitor 10 important sports KPIs in one interactive scorecard. Furthermore, it allows you to switch between MTD (Month-to-Date) and YTD (Year-to-Date) views instantly. Therefore, you gain full control over athlete and team performance.
What Is a Sports KPI Scorecard in Google Sheets?
A Sports KPI Scorecard in Google Sheets is a structured performance monitoring template designed for sports teams, coaches, academies, and sports managers.
Instead of reviewing separate match reports, you can:
- Track monthly performance
- Compare target vs actual
- Monitor percentage change
- Analyze MTD and YTD trends
- Identify strengths and weaknesses
Because this template runs in Google Sheets, you can access it from anywhere. Moreover, it updates automatically when you select a different month. Therefore, decision-making becomes faster and smarter.
Why Do Sports Teams Need a KPI Scorecard?
Click to Buy Sports KPI Scorecard in Google Sheets
Performance improvement requires measurement. However, without structured KPIs, teams often rely on guesswork.
For example:
- A team may win matches but struggle with fitness.
- An athlete may score goals but show poor consistency.
- A team may improve monthly but fail yearly targets.
Therefore, structured KPIs help teams stay focused.
When you use a Sports KPI Scorecard:
- You measure progress clearly.
- You compare performance against targets.
- You motivate athletes using visible results.
- You plan training sessions strategically.
As a result, you create continuous improvement.
Key Features of Sports KPI Scorecard in Google Sheets
Click to Buy Sports KPI Scorecard in Google Sheets
This ready-to-use template includes structured worksheets for full control.
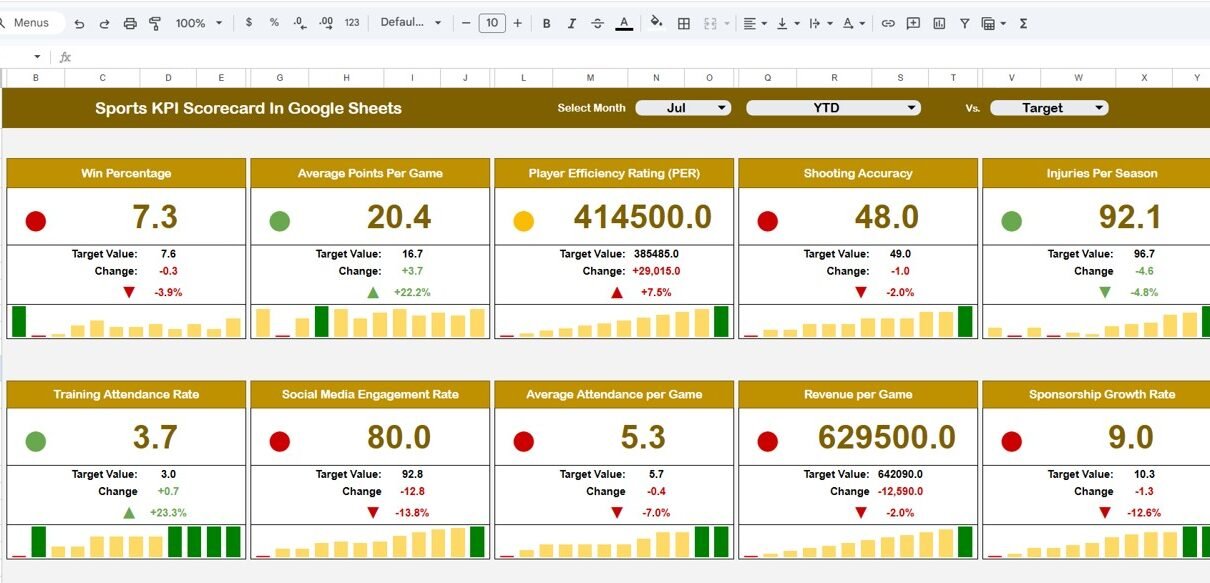
Scorecard Sheet Tab – How Does the Main Dashboard Work?
This is the main summary sheet.
At the top, you can select a Month from the dropdown menu. Once you select a month, the entire scorecard updates automatically.
It Displays:
- MTD Actual
- MTD Target
- MTD Previous Year
- Target vs Actual % Change
- PY vs Actual % Change
- YTD Actual
- YTD Target
- YTD Previous Year
Moreover, the dashboard uses:
- Traffic light indicators
- Up and down arrows
- Percentage change calculations
To view monthly data, click MTD.
To view yearly data, click YTD.
Therefore, performance monitoring becomes simple and visual.

Click to Buy Sports KPI Scorecard in Google Sheets
2️⃣Trend Sheet Tab – How Do You Track KPI Trends?
On the Trend Sheet, you can select the KPI name from dropdown available in Range C3.
This sheet displays:
- KPI Group
- Unit of KPI
- Type (Lower or Upper the Better)
- Formula
- KPI Definition
- Monthly Trend Chart
As a result, you can analyze performance growth over time.

Click to Buy Sports KPI Scorecard in Google Sheets
3️⃣ KPI Definition Sheet Tab – Where Do You Define KPIs?
In this sheet, you enter:
- KPI Name
- KPI Group
- Unit
- Formula
- KPI Definition
This sheet ensures clarity and consistency in measurement.

4️⃣ Data Input Sheet Tab – Where Do You Enter Data?
In the Data Input sheet, you input actual monthly numbers for each KPI.
Once you enter the data, the scorecard updates automatically. Therefore, you always see the latest performance.

Click to Buy Sports KPI Scorecard in Google Sheets
5️⃣ Colour Settings Sheet – How Do Indicators Work?
This sheet controls:
- Traffic light colors
- Up and down arrow rules
- Conditional formatting thresholds
Because of this configuration, performance visualization becomes dynamic and meaningful.

Click to Buy Sports KPI Scorecard in Google Sheets
Advantages of Sports KPI Scorecard in Google Sheets
Clear Performance Measurement
You track team and player KPIs easily.
Goal Monitoring
You compare actual performance with targets.
Trend Analysis
You monitor monthly and yearly growth.
Visual Indicators
Traffic lights and arrows simplify performance review.
Cloud Accessibility
You access your scorecard anytime.
Time Efficiency
You reduce manual reporting effort.
Therefore, this scorecard improves team management.
Best Practices for the Sports KPI Scorecard
Click to Buy Sports KPI Scorecard in Google Sheets
To maximize results, follow these best practices:
Update Data Regularly
Enter match data immediately after each game.
Set Realistic Targets
Use historical data to define goals.
Review Trends Monthly
Analyze trend charts consistently.
Focus on Weak Areas
Improve KPIs marked in red indicators.
Maintain Data Accuracy
Ensure correct data entry in input sheet.
When you follow these steps, performance improves consistently.
Conclusion
Sports success requires discipline, strategy, and data-driven decisions. A Sports KPI Scorecard in Google Sheets provides structured performance tracking using 10 critical KPIs.
Moreover, with dynamic month selection, MTD/YTD comparison, traffic light indicators, and trend analysis, this template transforms raw numbers into actionable insights.
Therefore, if you want to manage your sports team professionally and improve performance continuously, start using this Sports KPI Scorecard today.
Frequently Asked Questions with Answers
Click to Buy Sports KPI Scorecard in Google Sheets
1. What is a Sports KPI Scorecard in Google Sheets?
It is a ready-to-use template that tracks sports performance KPIs monthly and yearly.
2. Can I change the month in the dashboard?
Yes, you can select any month from the dropdown menu at the top.
3. Does the scorecard support MTD and YTD analysis?
Yes, you can switch between MTD and YTD views instantly.
4. How many KPIs are included?
The template includes 10 performance KPIs.
5. Can I customize KPI definitions?
Yes, you can edit KPI details in the KPI Definition sheet.
6. Are traffic lights automatic?
Yes, conditional formatting updates automatically based on performance.
7. Who can use this scorecard?
Coaches, sports academies, and team managers can use it effectively.
Watch the step-by-step video tutorial:
Visit our YouTube channel to learn step-by-step video tutorials