Managing a subscription box business requires keeping track of multiple key metrics, from subscriber growth to retention rates, revenue per subscriber, and fulfillment efficiency. The Subscription Box KPI Dashboard in Google Sheets is a ready-to-use tool that centralizes all performance metrics, helping subscription box businesses monitor, analyze, and optimize their operations.Subscription Box KPI Dashboard in Google Sheets
This dashboard is ideal for subscription managers, e-commerce teams, and operations analysts who want to make data-driven decisions.Subscription Box KPI Dashboard in Google Sheets
What is a Subscription Box KPI Dashboard?
A KPI Dashboard is a visual management tool that displays the most important performance metrics of a business in one place.
For a subscription box business, key performance indicators (KPIs) may include:
-
New subscribers acquired
-
Subscription churn rate
-
Monthly recurring revenue (MRR)
-
Average order value
-
Fulfillment and delivery efficiency
-
Customer satisfaction ratings
Using Google Sheets provides real-time updates, cloud access, and easy collaboration, making it simple for teams to track performance trends across multiple KPIs.
Key Features of the Dashboard
Click to Buy Subscription Box KPI Dashboard in Google Sheets
This Subscription Box KPI Dashboard is structured with 6 main worksheets, each serving a specific purpose:
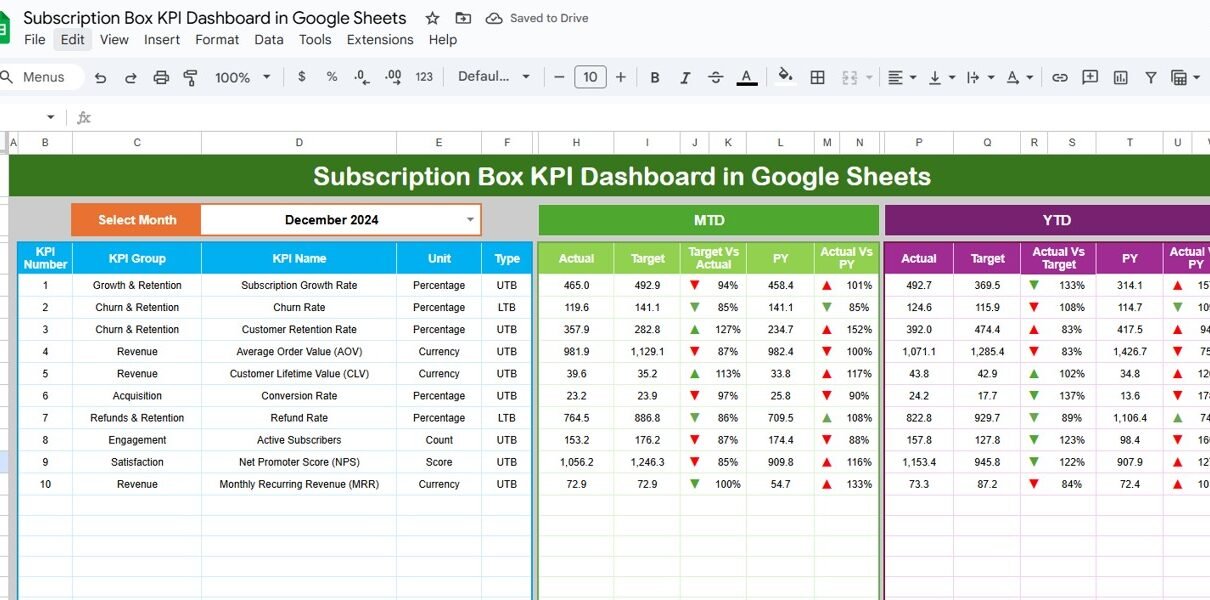
1. Dashboard Sheet Tab
The Dashboard sheet is the main visual interface.
-
Select the month from cell D3 to update all dashboard metrics for that period.
-
Displays MTD (Month-to-Date) Actuals, Targets, and Previous Year Data, with conditional formatting to show up/down arrows for target vs actual and PY vs actual comparisons.
-
Shows YTD (Year-to-Date) metrics with similar conditional formatting, giving a full-year perspective.
This sheet provides a comprehensive snapshot of business performance at a glance, allowing managers to quickly identify areas of success or concern.

Click to Buy Subscription Box KPI Dashboard in Google Sheets
2. KPI Trend Sheet Tab
The KPI Trend sheet allows for detailed trend analysis.
-
Select the KPI from cell C3 dropdown.
-
Displays KPI Group, Unit, KPI Type (Lower the Better / Upper the Better), Formula, and Definition.
-
Helps analyze performance over time and identify long-term trends.

3. Actual Numbers Sheet Tab
This sheet is the data entry point for actual performance numbers:
-
Enter MTD and YTD actual values for each KPI.
-
Change the month from cell E1, which should be set to the first month of the year.
-
Updates the dashboard automatically based on entered values.

Click to Buy Subscription Box KPI Dashboard in Google Sheets
4. Target Sheet Tab
The Target sheet is where you define performance goals:
-
Input monthly targets for each KPI (MTD and YTD).
-
Ensures that the dashboard can calculate target vs actual variances and show achievement rates.

5. Previous Year Numbers Sheet Tab
This sheet stores previous year data, allowing comparison of current performance against last year’s metrics:
-
Helps identify growth trends or declining performance areas.
-
Automatically feeds into the dashboard visualizations for PY vs Actual analysis.

Click to Buy Subscription Box KPI Dashboard in Google Sheets
6. KPI Definition Sheet Tab
The KPI Definition sheet is a reference table for all key metrics:
-
Enter KPI Name, KPI Group, Unit, Formula, and KPI Definition.
-
Ensures consistent understanding of KPIs across the team.
-
Indicates whether the KPI is Lower the Better (LTB) or Upper the Better (UTB).

Benefits of Using this Dashboard
-
Centralized Performance Tracking: All KPIs in one place for easy monitoring.
-
Interactive Insights: Real-time dashboard updates with MTD, YTD, and PY comparisons.
-
Data-Driven Decisions: Quickly identify underperforming areas and growth opportunities.
-
Customizable Metrics: Adjust KPIs, targets, and actuals as your subscription business evolves.
-
Trend Analysis: Historical comparison using the KPI Trend sheet.
Opportunities for Improvement
Click to Buy Subscription Box KPI Dashboard in Google Sheets
-
Conditional Formatting Enhancements: Color-code KPIs for instant visual recognition of performance.
-
Integration with Subscription Systems: Connect Google Sheets with your CRM or e-commerce platform for automated updates.
-
Custom KPI Alerts: Add notifications for KPIs that fall below thresholds.
-
Visual Expansion: Include additional charts for revenue trends, churn rate breakdowns, or subscriber growth projections.
Best Practices
-
Update Numbers Regularly: Ensure MTD and YTD actuals are entered accurately every month.
-
Review KPI Definitions: Standardize formulas and units to avoid misinterpretation.
-
Monitor Trends: Use the KPI Trend sheet to track long-term performance.
-
Set Realistic Targets: Define achievable monthly and yearly goals for all KPIs.
-
Collaborate in Cloud: Share the Google Sheets dashboard with authorized team members for consistent monitoring.
Conclusion
Click to Buy Subscription Box KPI Dashboard in Google Sheets
The Subscription Box KPI Dashboard in Google Sheets is a powerful and ready-to-use solution for tracking all subscription business metrics efficiently.
With this dashboard, teams can:
-
Track subscriber acquisition, retention, and revenue growth
-
Compare actual performance against targets and previous year
-
Analyze trends and make informed decisions for business improvement
This template streamlines performance management, saving time and providing actionable insights to grow your subscription box business effectively.
Visit our YouTube channel to learn step-by-step video tutorials
Youtube.com/@NeotechNavigators
Watch the step-by-step video Demo:
Click to Buy Subscription Box KPI Dashboard in Google Sheets