Sustainability is no longer just a buzzword—it’s a business imperative. Organizations across industries are increasingly focusing on sustainability metrics to track their environmental, social, and governance (ESG) performance. Monitoring these KPIs helps companies comply with regulations, reduce environmental impact, and enhance corporate responsibility.
Our Sustainability Reporting KPI Dashboard in Google Sheets is a ready-to-use tool designed to simplify sustainability reporting while providing actionable insights. This article explores the dashboard’s features, benefits, and best practices for effective sustainability monitoring.
What is a Sustainability Reporting KPI Dashboard?
Click to Buy Sustainability Reporting KPI Dashboard in Google Sheets
A Sustainability Reporting KPI Dashboard is a data-driven tool that allows organizations to track key sustainability metrics across different dimensions, such as energy consumption, carbon emissions, waste management, water usage, and social impact.
Using Google Sheets for this purpose offers several advantages:
-
Centralized Tracking: All sustainability KPIs in a single dashboard.
-
Ease of Use: User-friendly interface with drop-downs and conditional formatting.
-
Real-Time Analysis: Instantly see the MTD (Month-to-Date) and YTD (Year-to-Date) performance.
-
Data Visualization: Conditional formatting and charts highlight performance trends and areas requiring attention.
By combining automated data aggregation with visual indicators, the dashboard ensures informed decision-making and strategic planning.
Key Features of the Sustainability Reporting KPI Dashboard
The template is designed with 6 worksheets, each serving a distinct purpose for monitoring, reporting, and analyzing sustainability KPIs:
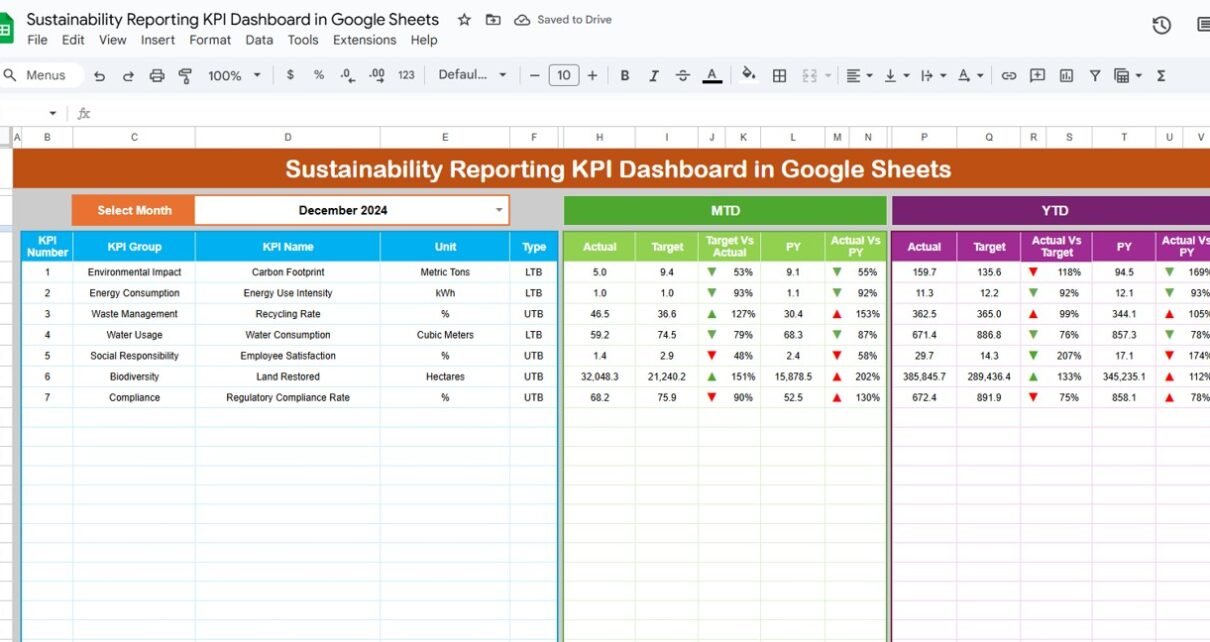
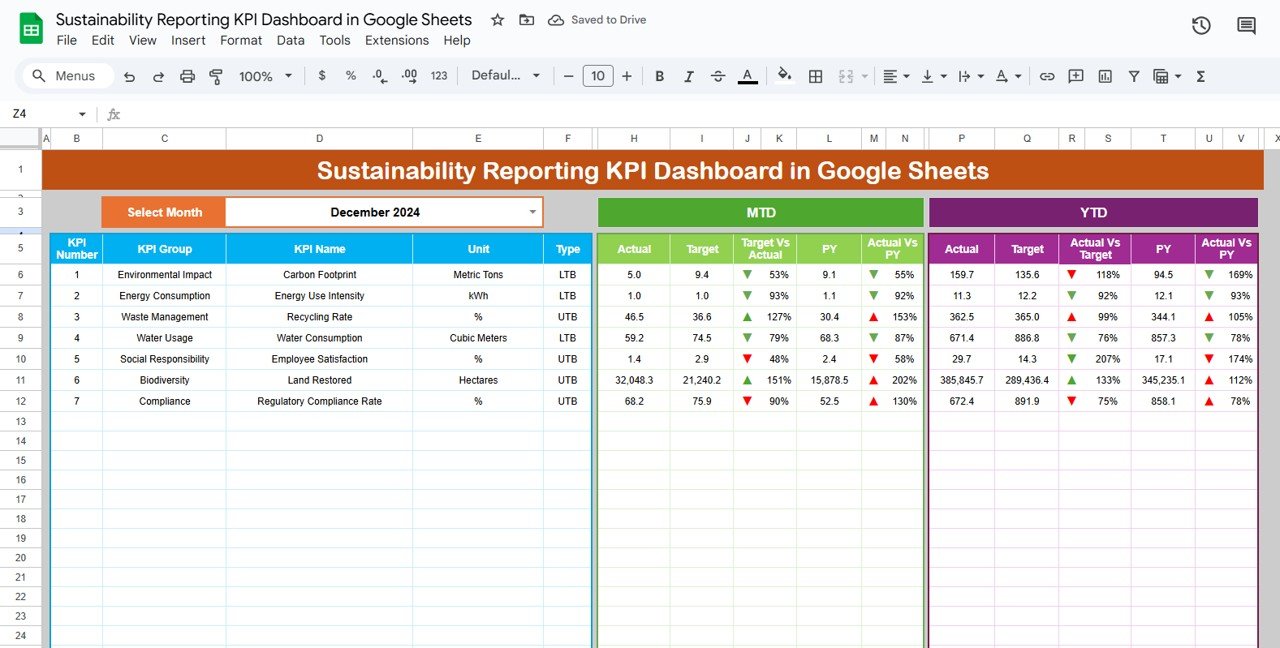
1. Dashboard Sheet Tab
The Dashboard Sheet is the main interface where all KPIs are displayed.
Key Features:
-
Month Selection: Choose the month from the drop-down in cell D3 to update the dashboard automatically.
-
MTD & YTD Metrics: Displays MTD Actual, Target, Previous Year, Target vs Actual, and PY vs Actual with conditional formatting (up/down arrows).
-
Performance Visualization: Easily identify KPIs performing above or below targets.
This sheet provides a comprehensive snapshot of sustainability performance at a glance.
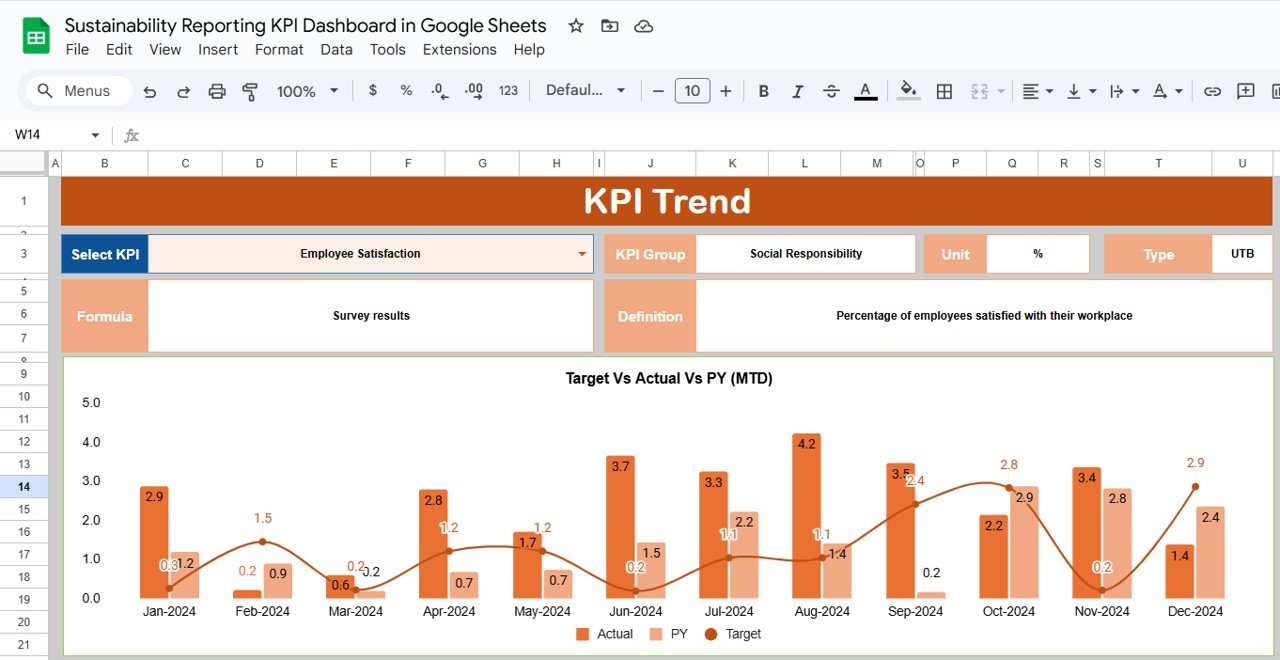
2. KPI Trend Sheet Tab
Click to Buy Sustainability Reporting KPI Dashboard in Google Sheets
The KPI Trend Sheet allows detailed tracking of individual KPIs.
Key Features:
-
Select a KPI from the drop-down in cell C3.
-
View KPI Group, Unit, Type (Lower the Better / Upper the Better), Formula, and Definition.
-
Analyze trends and deviations over time to identify performance gaps.
This sheet is ideal for deep-dives into specific sustainability metrics.
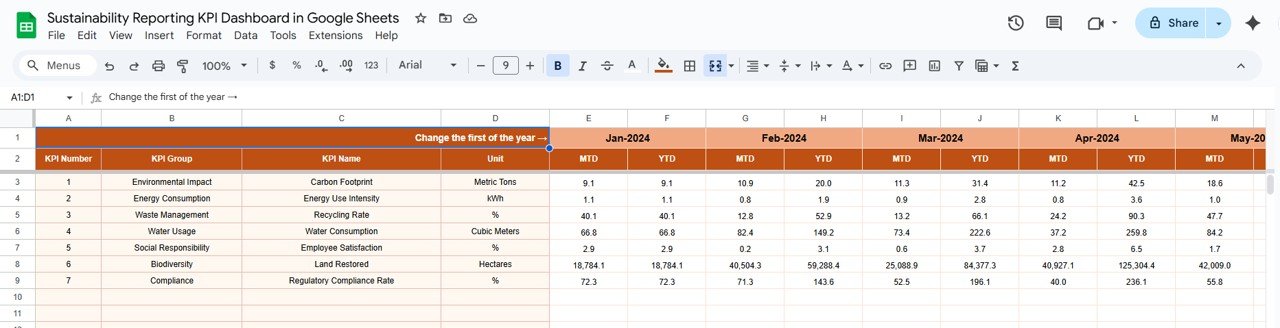
3. Actual Number Sheet Tab
The Actual Number Sheet is where you record the real performance numbers for MTD and YTD metrics.
Key Features:
-
Change the month from cell E1 to enter or view actual numbers for that period.
-
Record monthly and cumulative YTD values for all KPIs.
-
Supports pivot-based reporting for dynamic dashboard updates.
This sheet ensures accurate and consistent tracking of actual performance data.
Click to Buy Sustainability Reporting KPI Dashboard in Google Sheets
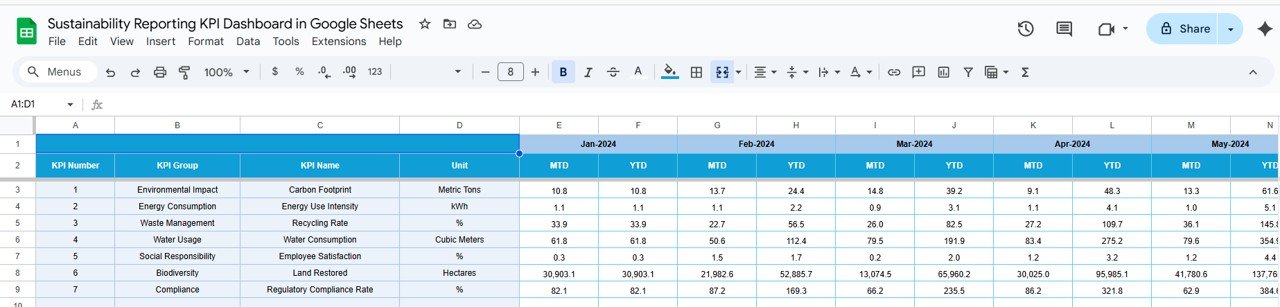
4. Target Sheet Tab
The Target Sheet is where you set performance targets for each KPI.
Key Features:
-
Enter monthly MTD and YTD targets.
-
Supports automatic calculation of Target vs Actual performance on the dashboard.
-
Helps monitor progress toward organizational sustainability goals.
By comparing targets vs actuals, organizations can take corrective actions proactively.
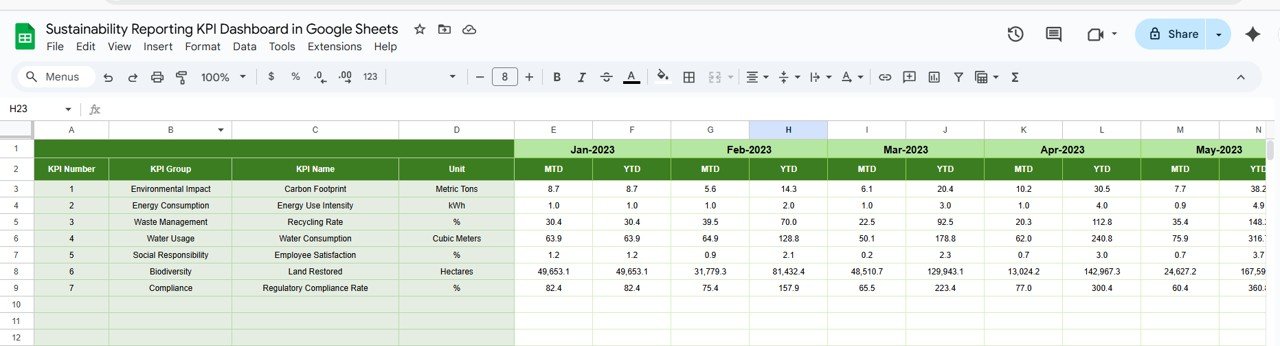
5. Previous Year Number Sheet Tab
This sheet records previous year’s numbers for all KPIs.
Key Features:
-
Provides a benchmark for performance evaluation.
-
Enables comparison between current and prior year results.
-
Helps identify improvement areas and measure year-over-year progress.
Tracking historical data ensures informed planning and sustainability strategy adjustments.
Click to Buy Sustainability Reporting KPI Dashboard in Google Sheets
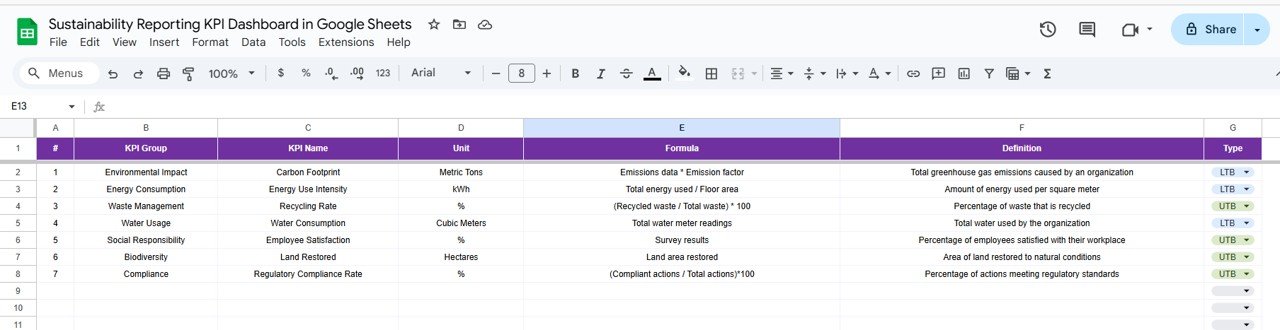
6. KPI Definition Sheet Tab
The KPI Definition Sheet provides a reference for all metrics used in the dashboard.
Key Features:
-
Record KPI Name, KPI Group, Unit, Formula, and Definition.
-
Indicate whether the KPI is Lower the Better (LTB) or Upper the Better (UTB).
-
Supports consistency and clarity across all sustainability reports.
This sheet acts as a single source of truth for KPI definitions and formulas.
Benefits of Using the Dashboard
-
Real-Time Monitoring: View current performance vs targets instantly.
-
Improved Accountability: Assign KPI owners for MTD and YTD tracking.
-
Data-Driven Decisions: Identify underperforming areas and plan interventions.
-
Regulatory Compliance: Track KPIs required for ESG reporting and audits.
-
Visualization: Conditional formatting and trend analysis highlight KPIs requiring attention.
Opportunities for Improvement
Click to Buy Sustainability Reporting KPI Dashboard in Google Sheets
-
Add Scorecards: Create weighted scores for combined KPI performance.
-
Dynamic Graphs: Use charts to visualize trends and comparisons.
-
Automated Alerts: Set up Google Sheets notifications for missed targets.
-
Integration: Link with other data sources such as ERP or energy meters for automatic data updates.
-
Benchmarking: Compare KPIs against industry or regulatory standards.
Best Practices
-
Update Regularly: Keep the Actual and Target sheets current for accurate reporting.
-
Standardize KPIs: Ensure units and formulas are consistent across all KPIs.
-
Assign Responsibilities: Clearly define owners for each KPI.
-
Review Trends: Analyze KPI trends monthly to identify improvement opportunities.
-
Share Dashboard: Use Google Sheets sharing to allow team access for collaboration.
Conclusion
Click to Buy Sustainability Reporting KPI Dashboard in Google Sheets
The Sustainability Reporting KPI Dashboard in Google Sheets provides a comprehensive, easy-to-use platform for monitoring, analyzing, and reporting sustainability performance. By leveraging this dashboard, organizations can:
-
Track MTD and YTD KPI performance
-
Compare current metrics with targets and previous year data
-
Identify gaps and take proactive measures
-
Ensure accurate and consistent sustainability reporting
Visit our YouTube channel to learn step-by-step video tutorials
Youtube.com/@NeotechNavigators
Watch the step-by-step video Demo:
Click to Buy Sustainability Reporting KPI Dashboard in Google Sheets