In the modern data-driven era, businesses succeed not by collecting data—but by turning that data into actionable insights. To achieve this, teams need visibility into key performance indicators (KPIs) that show how well their data initiatives perform. This is where a Data Analytics KPI Dashboard in Google Sheets becomes invaluable.Data Analytics KPI Dashboard in Google […]
Tag: business intelligence
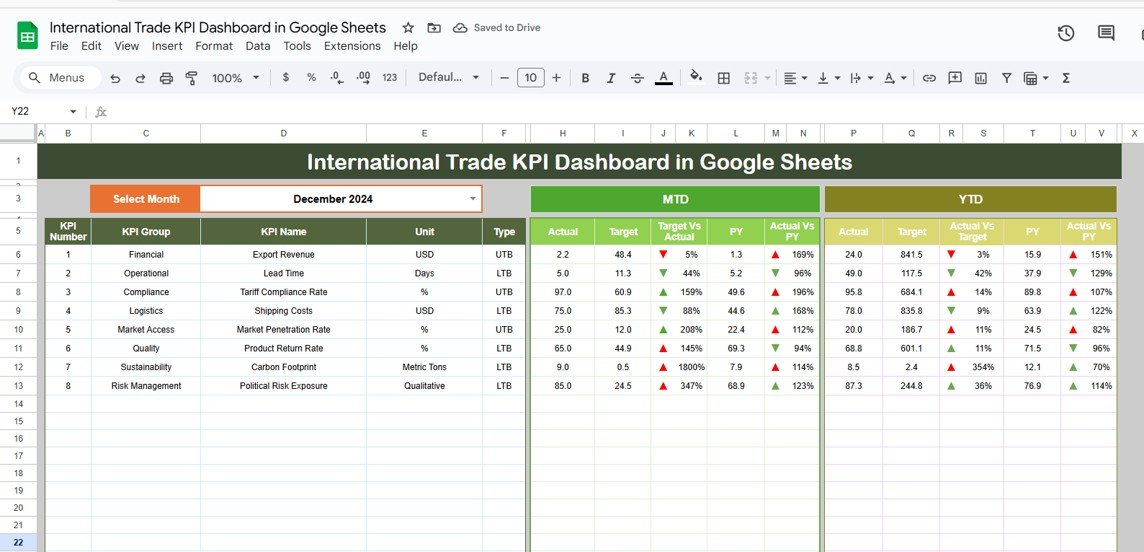
International Trade KPI Dashboard in Google Sheets
In today’s highly competitive global market, businesses engaged in international trade need accurate and real-time insights to track performance, mitigate risks, and ensure sustainable growth. But manually managing trade data can quickly become overwhelming and inefficient. That’s where the International Trade KPI Dashboard in Google Sheets proves invaluable. This easy-to-use, highly customizable template helps trade […]
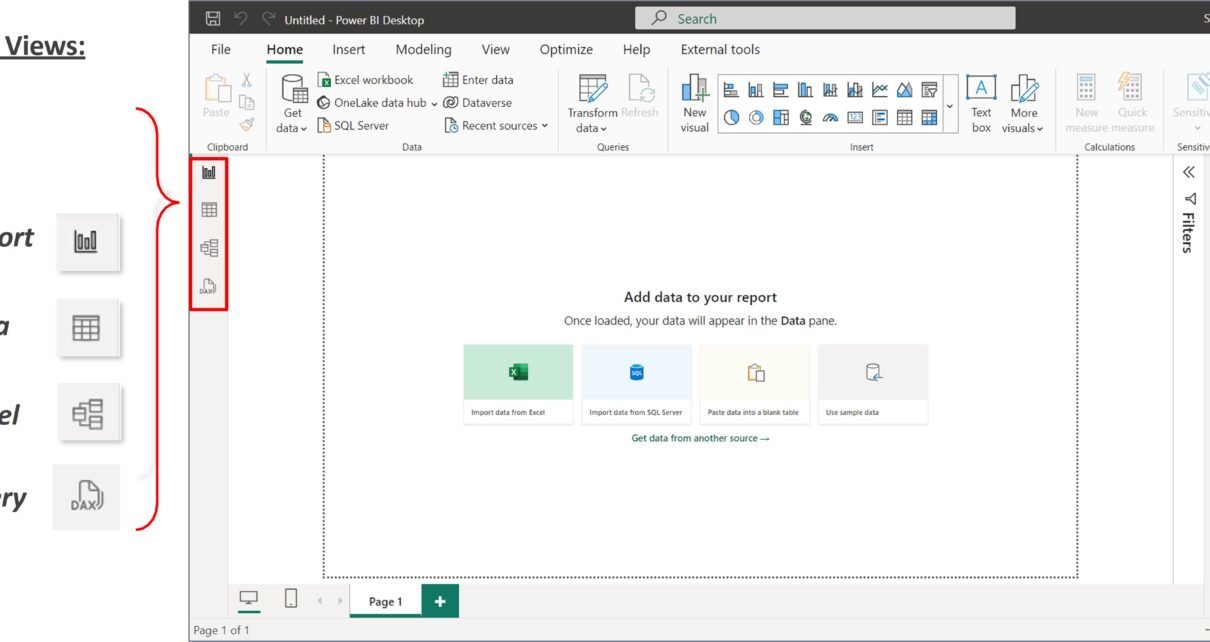
Components of Power BI – Power BI Desktop, Service & Mobile
Power BI is not just one tool. It is a collection of tools and services that work together to help you analyze, visualize, and share data. Each component of Power BI has a specific role. When combined, they give you everything you need for effective business intelligence. In this topic, we’ll break down the three […]
What is Power BI? – A Beginner’s Guide
Power BI is a data visualization and business intelligence tool created by Microsoft. It helps you connect to your data, analyze it, and build interactive reports and dashboards.What is Power BI With Power BI, you don’t need to be a data expert. It gives you a simple and visual way to explore numbers, patterns, and […]
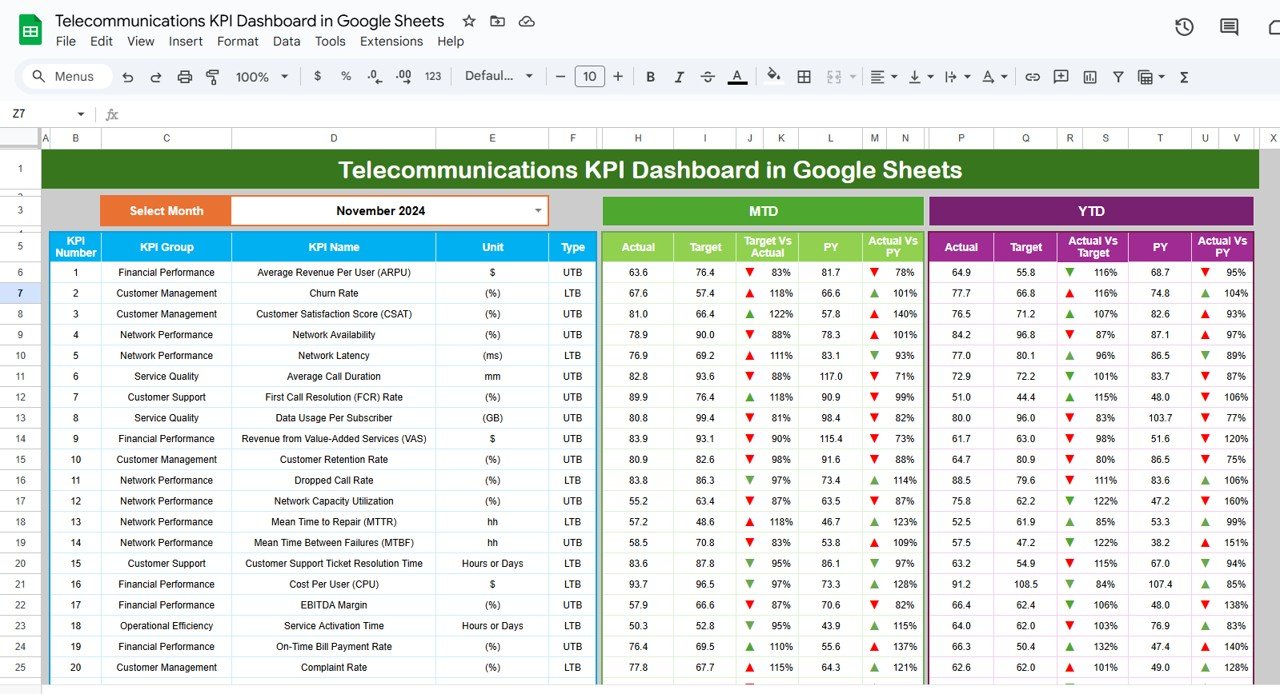
Telecommunications KPI Dashboard in Google Sheets
In today’s highly competitive telecommunications industry, measuring performance is crucial for making data-driven decisions. One of the most effective ways to track performance is through a Telecommunications KPI Dashboard. By using a Telecommunications KPI Dashboard in Google Sheets, companies can efficiently monitor their Key Performance Indicators (KPIs) and ensure they are on track to meet […]
JSON Connectivity in Power BI
Power BI is a fantastic tool for analyzing and visualizing data, and it’s flexible enough to support various data formats. One of the most widely used formats is JSON (JavaScript Object Notation). JSON is a lightweight and human-readable data format commonly used by web services and APIs to exchange data. In this guide, we’ll walk […]
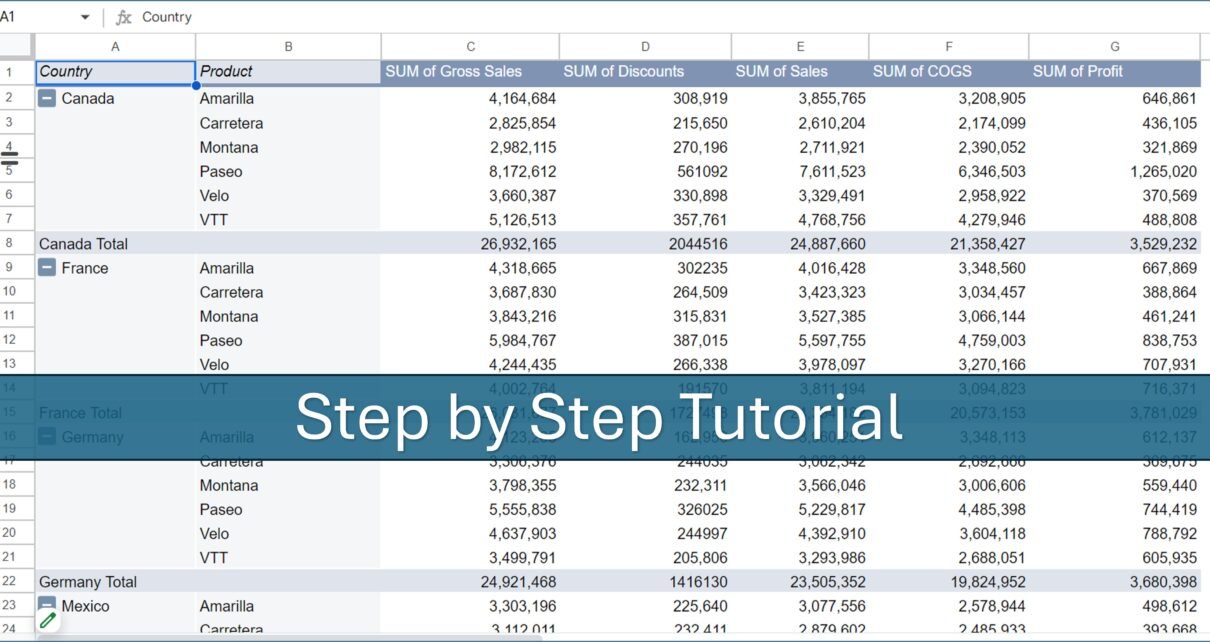
Pivot Table Guide for Google Sheets
Pivot tables are a powerful tool in Google Sheets, enabling users to summarize, analyze, explore, and present data comprehensively. This article is Pivot Table Guide for Google Sheets creating, using, and optimizing pivot tables in Google Sheets, leveraging straightforward examples and practical tips. What is a Pivot Table in Google Sheets? A pivot table is […]


