Pivot tables are a powerful tool in Google Sheets, enabling users to summarize, analyze, explore, and present data comprehensively. This article is Pivot Table Guide for Google Sheets creating, using, and optimizing pivot tables in Google Sheets, leveraging straightforward examples and practical tips.
What is a Pivot Table in Google Sheets?
A pivot table is an interactive way to quickly summarize large amounts of data. You can use pivot tables to extract significance from a detailed dataset, identify trends, or organize information. In Google Sheets, pivot tables are flexible and accessible, allowing users to pivot data ranges dynamically to see different summaries of the source data.
How to Create a Pivot Table Guide for Google Sheets.
Creating a pivot table in Google Sheets is straightforward. Here’s a quick step-by-step guide:
- Select Your Data: Highlight the data range you want to analyze. For our example, we’ll use a dataset that includes sales information across various products and countries.
- Insert Pivot Table: Go to Insert > Pivot table. Choose to place the pivot table in a new sheet to keep your data organized.
- Configure the Pivot Table: Once you create the pivot table, you’ll see a sidebar where you can add or remove fields to set your rows, columns, values, and filters according to what insights you need.
Explaining the Provided Data
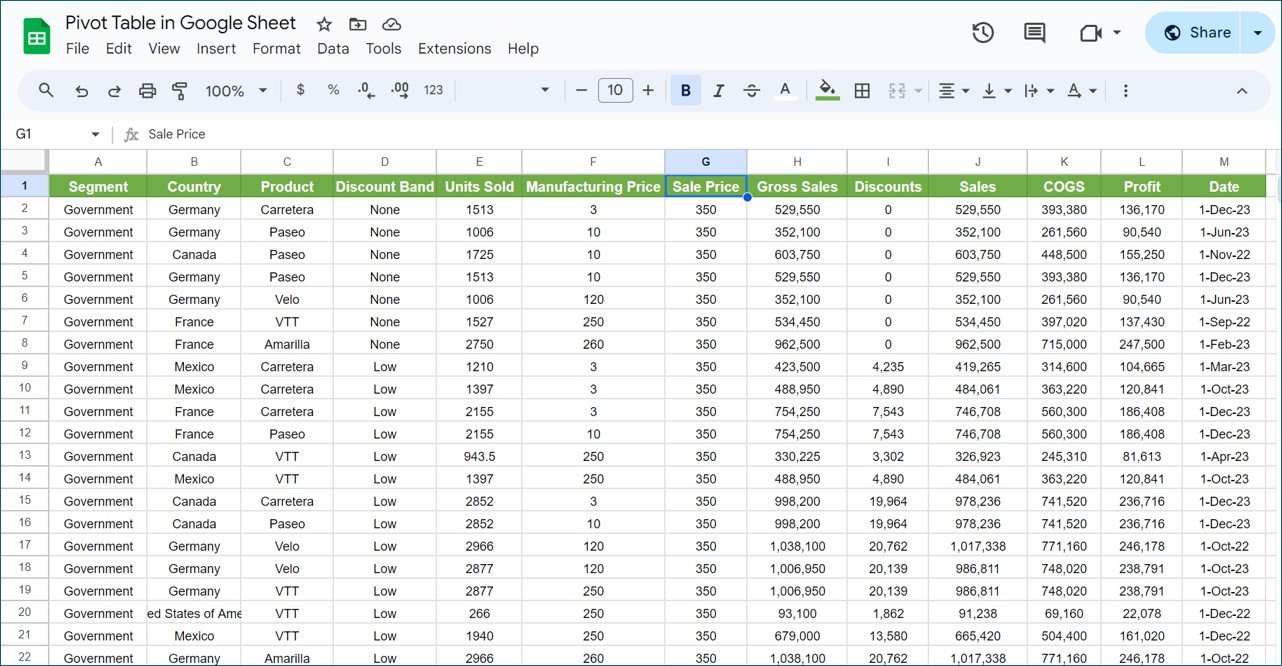
The data provided includes sales records of different products across several countries. Fields such as Segment, Country, Product, Discount Band, and Sales are included. Here’s what the data encompasses:
- Segment and Country: Specifies the market segment and country of the sales.
- Product and Discount Band: Details the product and any discounts applied.
- Sales Metrics: Includes units sold, manufacturing price, sale price, gross sales, discounts given, total sales, cost of goods sold (COGS), profit, and the date of the transaction.
Key Metrics Derived from Pivot Table Guide for Google Sheets.
Sum of Gross Sales for Each Product:
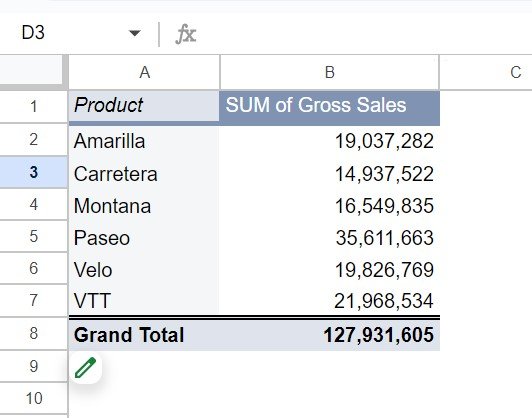
Step 1: Add ‘Product’ to the Rows area.
Step 2: Add ‘Gross Sales’ to the Values area, ensuring it’s set to SUM.
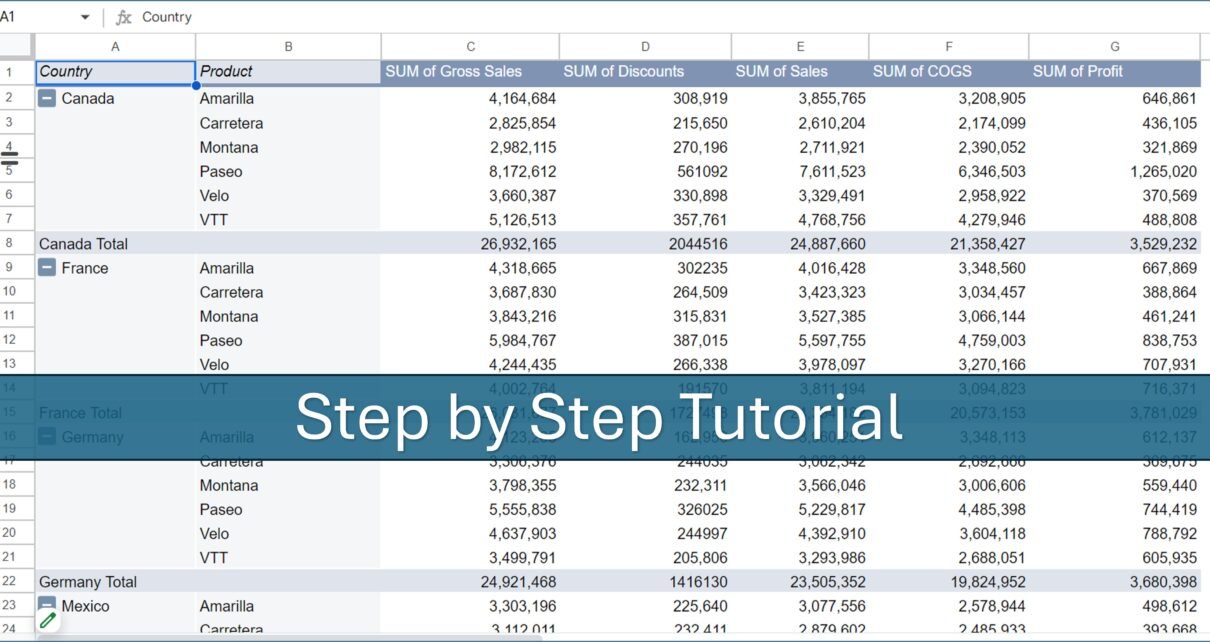
Country and Product Wise Sales Metrics:
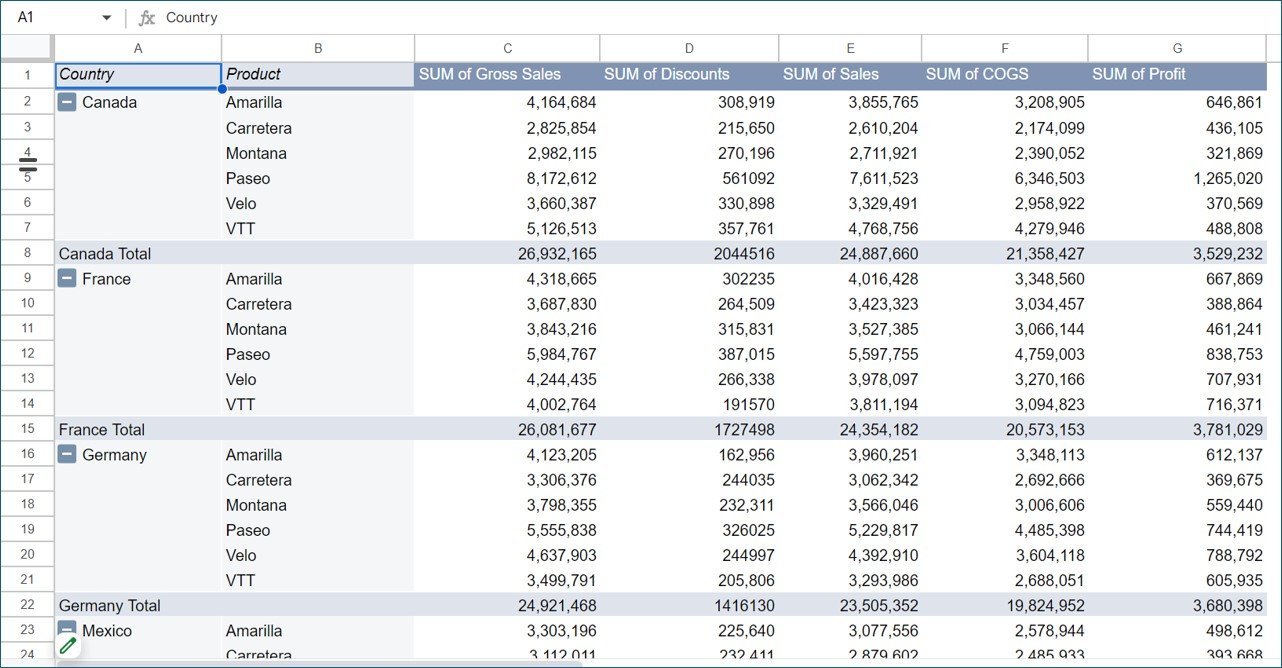
Step 1: Add ‘Country’ and ‘Product’ to the Rows area.
Step 2: Add ‘Gross Sales’, ‘Discounts’, ‘Sales’, ‘COGS’, and ‘Profit’ to the Values area, all set to SUM.
Segment and Country Wise Percent of Sales:
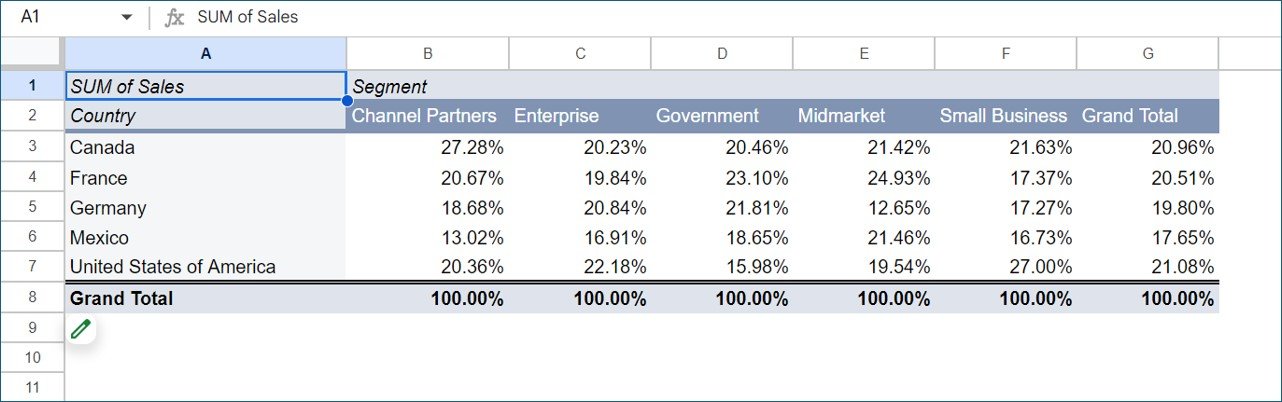
Step 1: Add ‘Country’ to the Rows area and ‘Segment’ to the Columns area.
Step 2: Add ‘Sales’ to the Values area and set it to display as a percentage of the column total.
Advantages of Using Pivot Tables in Google Sheets
- Efficient Data Summarization: Quickly condense large datasets into manageable summaries.
- Dynamic Data Interaction: Easily change the data range or pivot metrics to view different aspects of the data.
- No Formulas Required: Pivot tables manage the underlying calculations without the need for manual formulas.
Opportunities for Improvement in Pivot Table Usage
- Enhanced Customization: Google Sheets could improve by offering more advanced visualization options directly within pivot tables.
- Greater Data Handling Capacity: As datasets grow, performance can lag, highlighting the need for more robust data handling capabilities.
Best Practices for Pivot Tables in Google Sheets
- Keep Source Data Clean: Ensure that your source data is free from errors or duplicates to maintain accuracy in your pivot tables.
- Use Descriptive Labels: Rename your pivot table fields and values to be descriptive and straightforward for easier interpretation.
- Regularly Update Data Ranges: As you add new data, ensure your pivot table’s data range includes these updates.
Tips and Tricks for Pivot Table Guide for Google Sheets
- Double-Click to Drill Down: You can double-click on a summary figure to see the underlying data in a new sheet.
- Create Multiple Pivot Tables: Use several pivot tables to explore different facets of your data simultaneously.
- Use Filters: Apply filters to your pivot table to focus on specific segments or criteria.
Use Cases for Pivot Tables
- Monthly Sales Reports: Summarize sales by product and region to see top performers.
Financial Forecasting: Analyze historical data to predict future trends. - Inventory Management: Track inventory levels across multiple categories to optimize stock levels.
Conclusion
Pivot tables in Google Sheets offer a unique blend of simplicity and power, making them indispensable for anyone dealing with data. By mastering pivot tables, you can enhance your analytical abilities, make informed decisions, and present data compellingly.
Frequently Asked Questions
Q1: Can pivot tables update automatically?
A1: Yes, pivot tables can update automatically as new data is added to the source range, provided the data range includes the new entries.
Q2: How many data points can a Google Sheets pivot table handle?
A2: Google Sheets can technically handle up to 5 million cells, but performance may degrade with large datasets, especially in pivot tables.
Q3: Can I create a pivot chart in Google Sheets?
A3: Yes, after creating a pivot table, you can insert a chart that uses the pivot table data to visualize the results dynamically.
Visit our YouTube channel to learn step-by-step video tutorials
Youtube.com/@NeotechNavigators
Watch the step-by-step video tutorial:
Click here to get this template