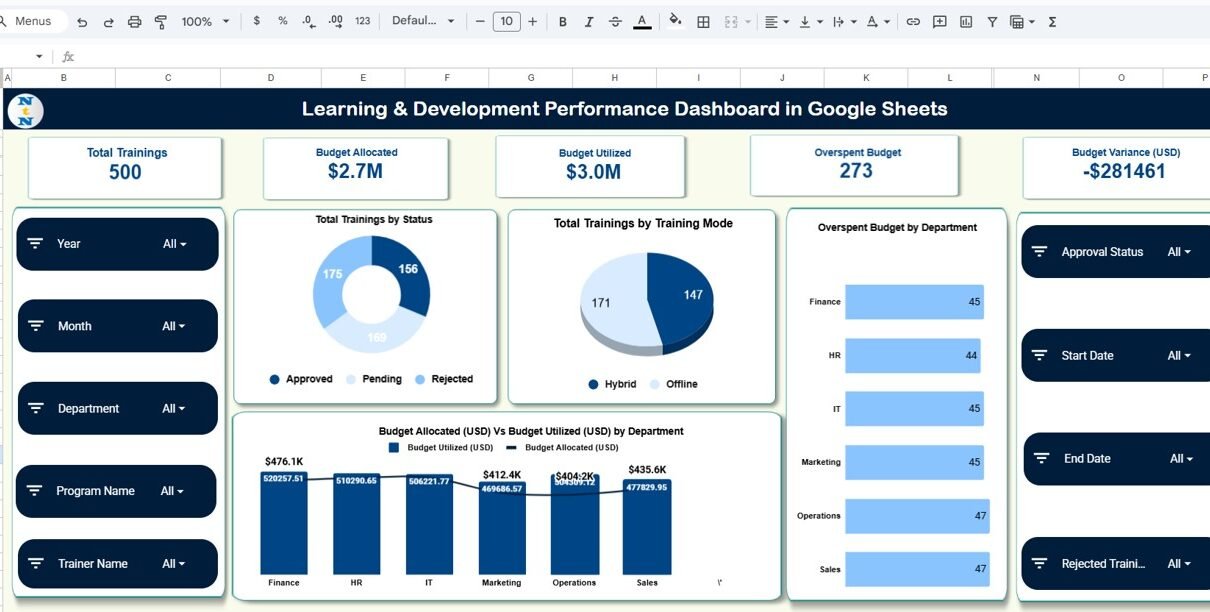
Every facility—whether it is an office building, school, hospital, warehouse, manufacturing unit, or retail space—requires ongoing maintenance and periodic renovation. However, tracking maintenance requests, renovation plans, estimated costs, priority levels, and department-wise needs becomes difficult when you do everything manually. Because of this, a Facility Maintenance & Renovation Tracker in Google Sheets becomes the perfect […]
Tag: Google Sheets Dashboard
Office Cleaning Request Tracker in Google Sheets
Cleanliness plays an important role in every office. It improves employee health, boosts productivity, and keeps the workplace safe. However, managing cleaning tasks, staff assignments, priority levels, and room-wise requests manually becomes difficult. Because of this, using an Office Cleaning Request Tracker in Google Sheets helps you manage everything in one place.Office Cleaning Request Tracker […]
Lease & Property Insights Dashboard in Google Sheets
Property managers handle many responsibilities every single day. They track lease agreements, monthly rent, security deposits, maintenance costs, tenant details, area usage, renewal dates, and property performance across different locations. As the number of properties grows, manual tracking becomes time-consuming and stressful. Because of this, a Lease & Property Insights Dashboard in Google Sheets helps […]
Team Performance Dashboard in Google Sheets
Managing a team becomes easier when you track tasks, hours, progress, performance, and workload in one place. When this information remains scattered across multiple sheets, managers struggle to take clear decisions. Therefore, you need a simple and powerful tool that shows true productivity in real time. A Team Performance Dashboard in Google Sheets solves this […]
Freight Cost KPI Dashboard in Google Sheets
Managing freight costs remains one of the biggest challenges in logistics and supply chain operations. Transport rates change often, fuel prices rise without warning, and delays create additional expenses. When teams track this information manually, they struggle to identify trends, compare monthly performance, and take quick action. However, a Freight Cost KPI Dashboard in Google […]
Corporate Sponsorship Request Tracker in Google Sheets
Managing corporate sponsorship requests can become complicated when details like event categories, requested amounts, approval status, and engagement scores are scattered across multiple spreadsheets or emails. To solve this challenge, the Corporate Sponsorship Request Tracker in Google Sheets provides a clean, structured, and ready-to-use system that helps organizations track, analyze, and manage sponsorship activity with […]
Customer Feedback Analysis Dashboard in Google Sheets
Understanding customer feedback is one of the most important parts of improving products, services, and customer experience. When feedback becomes difficult to organize, track, and analyze manually, businesses often miss important insights. To solve this challenge, the Customer Feedback Analysis Dashboard in Google Sheets provides a ready-to-use, fully automated, and visually rich solution.Customer Feedback Analysis […]
Cash Flow Template in Google Sheets
Managing cash flow is one of the most important financial tasks for any business. When companies fail to track inflows, outflows, and monthly balance changes, they face cash shortages, delayed payments, and inaccurate financial decisions. To solve this problem, the Cash Flow Template in Google Sheets provides a clean, structured, automated, and ready-to-use solution. This […]
Data Center KPI Dashboard in Google Sheets
Data centers are the backbone of digital infrastructure, supporting everything from enterprise applications to cloud services. To operate efficiently, safely, and reliably, data centers must monitor key performance indicators (KPIs) related to uptime, energy efficiency, cooling performance, asset usage, and service quality.Data Center KPI Dashboard in Google Sheets The Data Center KPI Dashboard in Google […]
Power Grid KPI Dashboard in Google Sheets
Power grid operations demand extremely high reliability, efficient transmission, minimal outages, and safety. To achieve this, power grid companies must monitor critical KPIs (Key Performance Indicators) that reflect system performance, quality of supply, load management, and operational efficiency.Power Grid KPI Dashboard in Google Sheets The Power Grid KPI Dashboard in Google Sheets is a ready-to-use, […]


