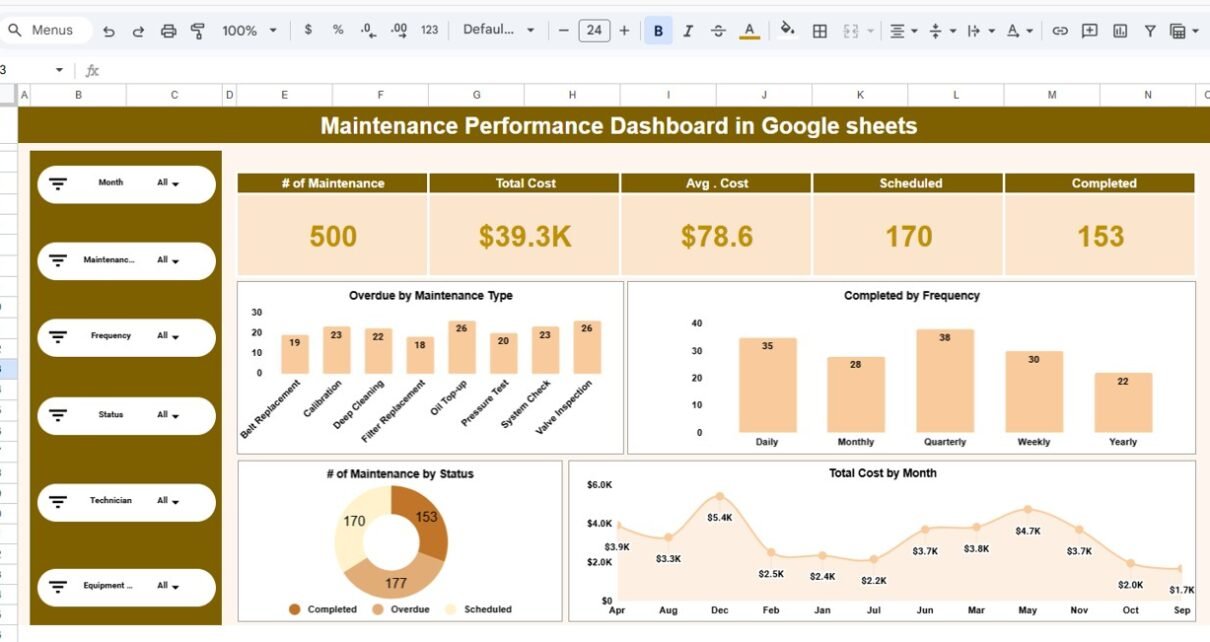
Templates

Aviation Operations KPI Dashboard in Google Sheets

Aviation operations demand precision, safety, and efficiency. Airlines, airports, and aviation service providers manage hundreds of operational metrics every day, such as on-time performance, flight delays, aircraft utilization, and safety compliance. However, when teams track these metrics across multiple reports, decision-making becomes slow and reactive.Aviation Operations KPI Dashboard in Google Sheets That is exactly why […]

KPI Dashboard

Ticket Resolution Time KPI Dashboard in Google Sheets

Ticket resolution time directly impacts customer satisfaction, operational efficiency, and service quality. Whether you manage IT support tickets, customer service requests, or internal helpdesk issues, delayed ticket resolution leads to frustration, SLA breaches, and increased costs. However, many teams still track ticket performance across emails or scattered spreadsheets, which makes monitoring slow and inaccurate.Ticket Resolution […]

KPI Dashboard

Customer Complaint Resolution KPI Dashboard in Google Sheets

Customer complaints directly impact brand reputation, customer loyalty, and revenue. When organizations fail to track complaints properly, resolution delays increase and customer satisfaction drops. Many teams still rely on emails, ticket logs, or disconnected spreadsheets, which makes complaint tracking inconsistent and reactive.Customer Complaint Resolution KPI Dashboard in Google Sheets This challenge makes a Customer Complaint […]

KPI Dashboard

Cultural Diversity KPI Dashboard in Google Sheets

Cultural diversity has become a critical success factor for modern organizations. Diverse teams bring better ideas, stronger collaboration, and improved business performance. However, organizations cannot improve diversity unless they measure it clearly and consistently. When diversity data remains scattered across HR systems or static reports, decision-making becomes slow and ineffective.Cultural Diversity KPI Dashboard in Google […]

KPI Dashboard

Technical Support KPI Dashboard in Google Sheets

Technical support teams play a critical role in customer satisfaction and business continuity. Every ticket, response, and resolution directly impacts user experience. However, when support data remains scattered across tools or static reports, teams struggle to measure performance and improve service quality. That is exactly why a Technical Support KPI Dashboard in Google Sheets becomes […]

KPI Dashboard

Retail Profit Margin KPI Dashboard in Google Sheets

Retail businesses operate on tight margins. Prices fluctuate. Costs increase. Customer behavior changes quickly. Therefore, retailers must monitor profit margins continuously to stay competitive and profitable. However, many teams still rely on scattered spreadsheets or delayed reports, which makes margin analysis slow and unreliable. That is exactly why a Retail Profit Margin KPI Dashboard in […]

KPI Dashboard

Product Return Rate KPI Dashboard in Google Sheets

Product returns directly affect profitability, customer satisfaction, inventory planning, and brand reputation. Therefore, businesses must track return patterns carefully and act quickly on insights. However, when return data stays scattered across reports or systems, teams struggle to identify root causes and trends.Product Return Rate KPI Dashboard in Google Sheets That is exactly why a Product […]

KPI Dashboard

Pricing Strategy KPI Dashboard in Google Sheets

Pricing decisions directly affect revenue, profitability, and market competitiveness. However, many organizations still rely on intuition, static reports, or disconnected spreadsheets to evaluate pricing performance. As a result, they miss opportunities to optimize margins, respond to market changes, and align pricing with business goals. That is exactly why a Pricing Strategy KPI Dashboard in Google […]

KPI Dashboard

Crisis Response KPI Dashboard in Google Sheets

During emergencies, incidents, or unexpected disruptions, organizations must respond quickly, accurately, and efficiently. Whether it is a natural disaster, IT outage, security incident, health emergency, or operational crisis, decision-makers need real-time visibility into response performance. However, many teams still rely on manual reports, scattered spreadsheets, or delayed updates, which slow down critical actions. That is […]