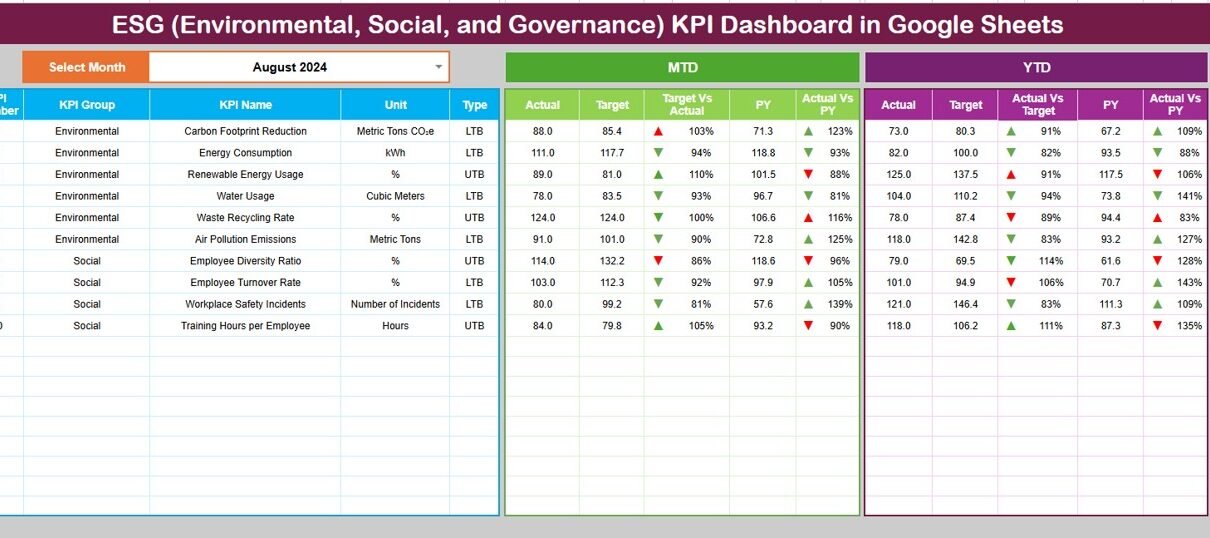
Organizations across the world now focus heavily on sustainability, social responsibility, and ethical governance. Investors, regulators, customers, and employees expect companies to measure and report ESG performance transparently. However, ESG data often remains scattered across departments, spreadsheets, and reports, which makes tracking and analysis difficult. This challenge makes an ESG (Environmental, Social, and Governance) KPI […]
Tag: Google Sheets KPI Dashboard
Technical Support KPI Dashboard in Google Sheets
Technical support teams play a critical role in customer satisfaction and business continuity. Every ticket, response, and resolution directly impacts user experience. However, when support data remains scattered across tools or static reports, teams struggle to measure performance and improve service quality. That is exactly why a Technical Support KPI Dashboard in Google Sheets becomes […]
Retail Profit Margin KPI Dashboard in Google Sheets
Retail businesses operate on tight margins. Prices fluctuate. Costs increase. Customer behavior changes quickly. Therefore, retailers must monitor profit margins continuously to stay competitive and profitable. However, many teams still rely on scattered spreadsheets or delayed reports, which makes margin analysis slow and unreliable. That is exactly why a Retail Profit Margin KPI Dashboard in […]
Product Return Rate KPI Dashboard in Google Sheets
Product returns directly affect profitability, customer satisfaction, inventory planning, and brand reputation. Therefore, businesses must track return patterns carefully and act quickly on insights. However, when return data stays scattered across reports or systems, teams struggle to identify root causes and trends.Product Return Rate KPI Dashboard in Google Sheets That is exactly why a Product […]
Pricing Strategy KPI Dashboard in Google Sheets
Pricing decisions directly affect revenue, profitability, and market competitiveness. However, many organizations still rely on intuition, static reports, or disconnected spreadsheets to evaluate pricing performance. As a result, they miss opportunities to optimize margins, respond to market changes, and align pricing with business goals. That is exactly why a Pricing Strategy KPI Dashboard in Google […]
Crisis Response KPI Dashboard in Google Sheets
During emergencies, incidents, or unexpected disruptions, organizations must respond quickly, accurately, and efficiently. Whether it is a natural disaster, IT outage, security incident, health emergency, or operational crisis, decision-makers need real-time visibility into response performance. However, many teams still rely on manual reports, scattered spreadsheets, or delayed updates, which slow down critical actions. That is […]
Regulatory Reporting KPI Dashboard in Google Sheets
Regulatory reporting is a critical responsibility for every organization operating in regulated industries such as banking, insurance, healthcare, utilities, telecom, and financial services. Regulatory bodies expect accurate, timely, and compliant reports. However, many organizations still rely on manual spreadsheets, emails, and fragmented systems. As a result, reporting delays, errors, and compliance risks increase. A Regulatory […]
Succession Planning KPI Dashboard in Google Sheets
Succession planning is no longer optional for modern organizations. When key leaders leave unexpectedly or critical roles remain vacant, businesses face serious operational and strategic risks. Because of this, HR teams and leadership need a clear, data-driven way to track succession readiness, talent pipeline strength, and leadership continuity. That is exactly where a Succession Planning […]
Green Energy Adoption KPI Dashboard in Google Sheets
Organizations across the world now focus on sustainability, carbon reduction, and clean energy adoption. Governments, investors, and customers expect businesses to measure and report their environmental performance clearly. However, many teams still struggle because they track green energy metrics using scattered spreadsheets and manual calculations. As a result, decision-making becomes slow and inaccurate. A Green […]
Water Usage Efficiency KPI Dashboard in Google Sheets
Water is one of the most valuable and limited resources for industries, municipalities, utilities, manufacturing plants, campuses, and commercial facilities. As water costs rise and sustainability regulations tighten, organizations must monitor water consumption carefully. However, when water data stays scattered across meters, reports, and spreadsheets, teams struggle to track efficiency and control waste. This is […]


