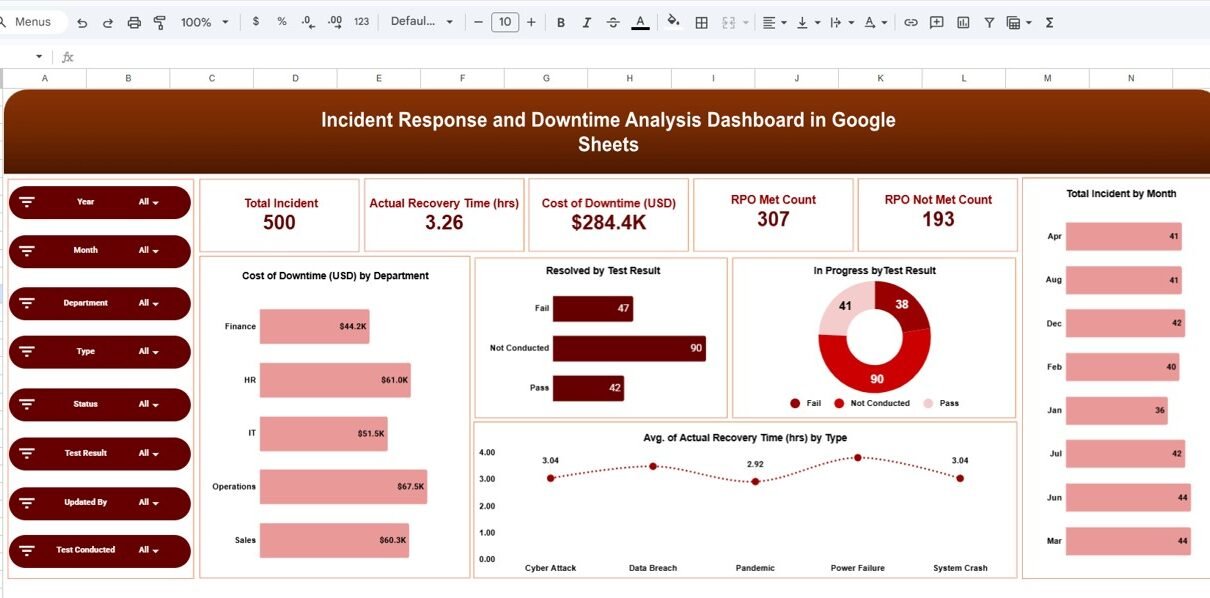
In today’s digital-first world, system failures, cyber attacks, and operational disruptions can cost businesses thousands of dollars every hour. However, many organizations still struggle to track incidents, measure recovery time, and analyze downtime effectively.Incident Response and Downtime Analysis Dashboard in Google Sheets So, how can you monitor incidents, reduce downtime, and improve response efficiency—all in […]
Tag: IT operations dashboard
IT Software Installation Request Tracker in Google Sheets
Every organization depends on software to run daily operations smoothly. Employees regularly request new software installations, license upgrades, reinstallations, or access to specialized tools. However, when IT teams manage these requests through emails, chats, or unstructured spreadsheets, delays increase, approvals get missed, and tracking becomes difficult. As a result, productivity drops and IT workloads grow.IT […]
IT Operations KPI Dashboard in Google Sheets
IT operations teams maintain the stability, performance, and availability of business systems. However, when systems grow complex, teams struggle to track incidents, downtime, service quality, costs, and workloads. Because of limited visibility, issues escalate faster, response slows down, and service quality suffers. That is why organizations now rely on structured KPI dashboards. An IT Operations […]


