HTML Dashboard

Supply Chain Analytics Dashboard in HTML

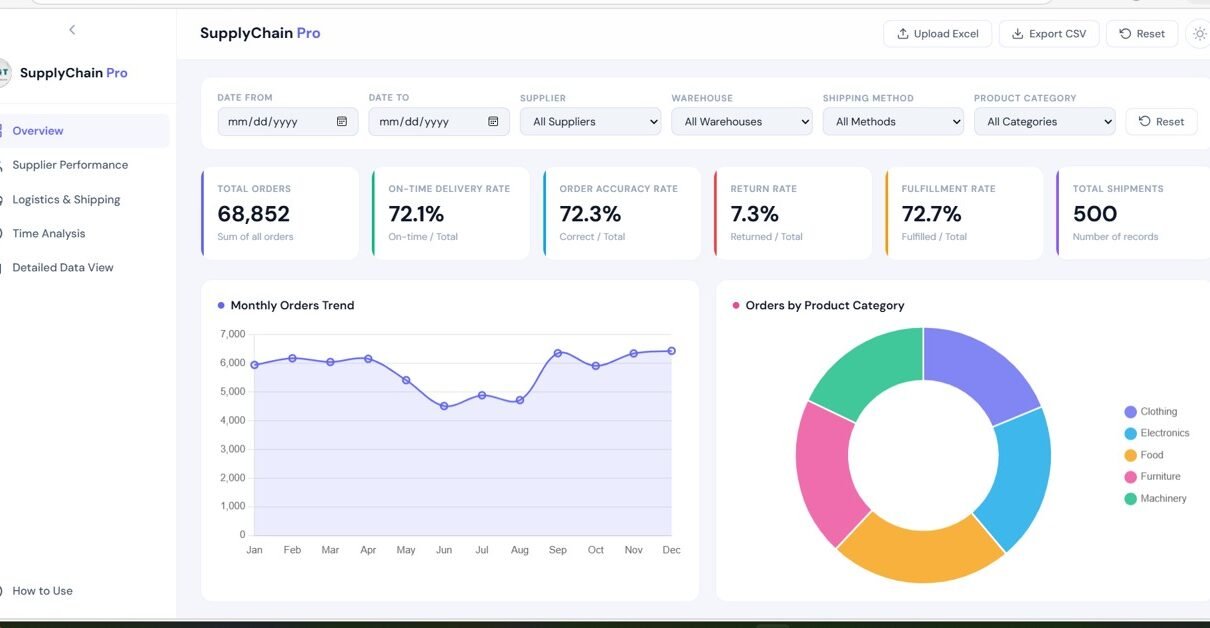
In today’s fast-paced business environment, managing supply chain operations efficiently is more important than ever. Companies deal with multiple suppliers, warehouses, shipping methods, and product categories. However, when this data is scattered across spreadsheets, it becomes difficult to gain meaningful insights. That’s exactly where the Supply Chain Analytics Dashboard in HTML comes in. This powerful, […]

Dashboard

Fleet Management Dashboard in Google Sheets

Managing a fleet of vehicles requires continuous monitoring of fuel consumption, maintenance expenses, mileage performance, and vehicle utilization. However, many organizations still rely on scattered spreadsheets or manual reports to track fleet operations. As a result, fleet managers often struggle to analyze vehicle performance and operational costs effectively. Therefore, organizations increasingly adopt data-driven fleet management […]

KPI Dashboard

Supply Chain – Logistics KPI Scorecard in Google Sheets

In the fast-paced world of logistics, efficiency and accuracy define success. Tracking performance across multiple supply chain functions — from order fulfillment to delivery time — is essential. The Supply Chain – Logistics KPI Scorecard in Google Sheets is a ready-to-use performance monitoring tool that allows businesses to evaluate, visualize, and optimize logistics operations efficiently.Supply […]

Google Sheets

Supply Chain – Logistics KPI Dashboard in Google Sheets

KPI Dashboard in Google Sheets In today’s fast-paced business world, optimizing logistics and supply chain performance is crucial. One of the best ways to achieve this is by tracking and analyzing key performance indicators (KPIs). A well-structured KPI dashboard can help managers and decision-makers monitor, track, and evaluate logistics and supply chain performance with precision. […]