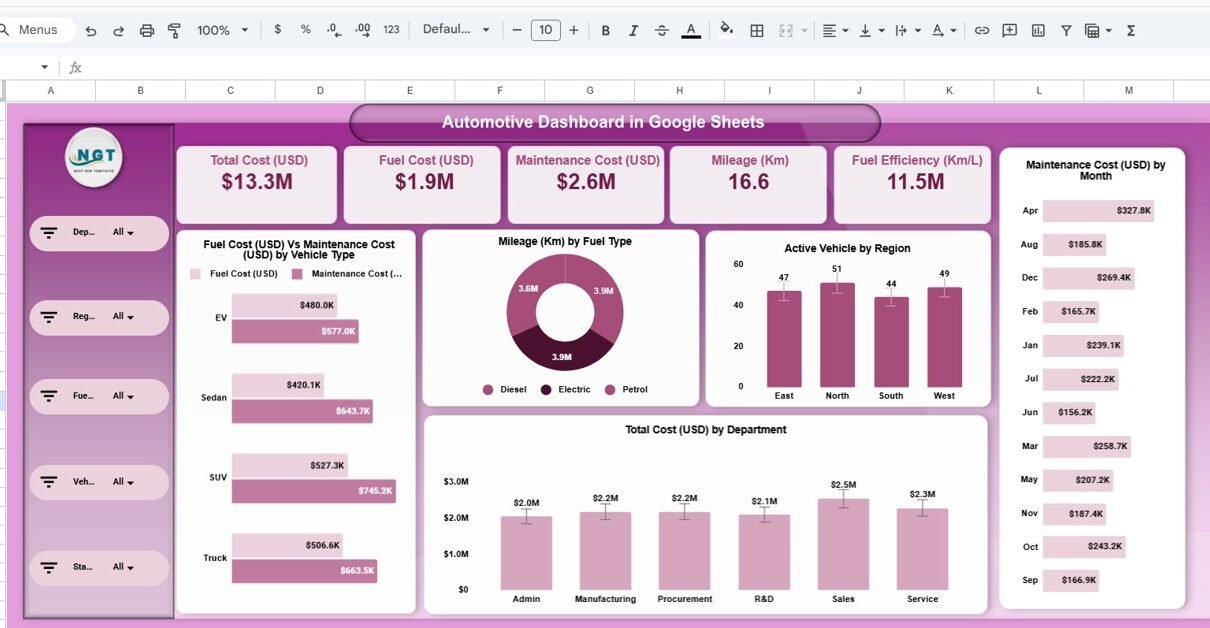
Managing automotive operations without structured reporting creates confusion. Many fleet managers, automotive companies, and transport departments track data in scattered sheets. As a result, they struggle to monitor fuel cost, maintenance cost, vehicle activity, and mileage trends effectively. Therefore, businesses need a centralized and interactive dashboard. More importantly, they need a ready-to-use system that converts […]
Tag: transport analytics
Fleet Utilization KPI Dashboard in Google Sheets
Fleet operations never slow down. Vehicles move daily. Fuel prices fluctuate. Maintenance costs increase. Delivery timelines tighten. Therefore, fleet managers must track utilization, cost, efficiency, and downtime continuously.Fleet Utilization KPI Dashboard in Google Sheets However, many companies still depend on manual spreadsheets. As a result, they struggle to measure vehicle performance. They miss maintenance signals. […]
Railway KPI Dashboard in Google Sheets
Railway operations involve complex processes such as train punctuality, safety, asset utilization, passenger services, and operational efficiency. Managing these activities without a structured KPI system often leads to delays, cost overruns, and reduced service quality. That is exactly why a Railway KPI Dashboard in Google Sheets becomes a powerful performance monitoring solution. This ready-to-use KPI […]


