Managing a team becomes easier when you track tasks, hours, progress, performance, and workload in one place. When this information remains scattered across multiple sheets, managers struggle to take clear decisions. Therefore, you need a simple and powerful tool that shows true productivity in real time. A Team Performance Dashboard in Google Sheets solves this challenge.
This ready-to-use dashboard gives a complete view of team activities, progress, and efficiency. It includes KPI cards, charts, and analytical pages that help you track performance effortlessly. In this article, you will learn how the dashboard works, why it is useful, and how you can use it to improve team productivity.
What Is a Team Performance Dashboard in Google Sheets?
Click to Buy Team Performance Dashboard in Google Sheets
A Team Performance Dashboard in Google Sheets is a performance-tracking system that helps you monitor your team’s workflow. You track total tasks, completed tasks, target hours, actual hours, in-progress tasks, performance levels, and monthly trends. The dashboard uses automatic formulas and dynamic charts that update instantly when you add or modify data.
Because the dashboard runs in Google Sheets, you can:
-
Access it from anywhere
-
Share it with your team
-
Collaborate with multiple people
-
Update data in real time
-
View charts without opening external tools
You save time, avoid errors, and improve productivity with one simple tool.
Why Teams Need This Dashboard
Every team—small or large—handles many tasks every day. Without a visual dashboard, teams face challenges such as:
- No clarity on workload
- Difficulty tracking pending tasks
- Lack of performance visibility
- Slow decision-making
- Miscommunication about priorities
- No real-time progress monitoring
A Team Performance Dashboard in Google Sheets solves these problems because it organizes all information into simple visuals and KPI cards. Managers gain total visibility, while team members understand expectations clearly.
Key Features of the Team Performance Dashboard in Google Sheets
Click to Buy Team Performance Dashboard in Google Sheets
This dashboard includes multiple features that make analysis quick, simple, and accurate. Let us explore them.
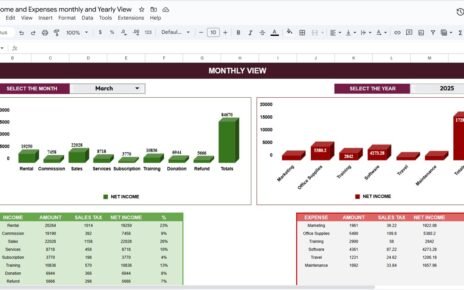
1. KPI Cards for Quick Overview
At the top of the dashboard, you see five essential KPI cards:
- Total Task: Shows the total number of tasks assigned.
- Completed Task: Displays how many tasks the team has completed.
- Avg. Target Hours: Shows the average expected time for tasks.
- Avg. Actual Hours: Shows the actual average time taken.
- In Progress Task: Helps you track tasks currently ongoing.
These cards help managers understand performance instantly.
Insightful Charts for Fast Decision-Making
Charts provide a clear picture of team activities. This dashboard includes powerful visuals such as:
- Avg. Actual Hours by Month: Shows how actual working hours trend monthly.
- In Progress Task by Task Type: Explains which task types stay incomplete for longer.
- Pending Task by Team: Helps you identify bottlenecks across teams.
These visuals help you understand productivity patterns and take action quickly.

Click to Buy Team Performance Dashboard in Google Sheets
Team Analysis Page
This section focuses on team-level performance. You can understand how each team performs in terms of workload, hours, and task handling.
Charts Included:
- Avg. Target Hours by Team: Shows the expected average hours team-wise.
- Avg. Actual Hours by Team: Explains how many hours teams actually spend.
- Total Task by Team: Helps you compare the number of tasks handled by each team.
Team Analysis helps managers balance workloads and plan resource allocation.

Task Analysis Page
Task Analysis helps you understand how different task types perform. Every organization has various task categories such as development, design, QA, planning, and documentation. Tracking each type becomes important.
Charts Included:
- Avg. Target Hours by Task Type: Shows expected hours for each category.
- Avg. Actual Hours by Task Type: Explains actual working hours by task category.
- Total Task by Task Type: Shows how many tasks are assigned under each task type.
You use this page to understand which task types take more time or need better planning.

Click to Buy Team Performance Dashboard in Google Sheets
Performance Analysis Page
This page focuses entirely on performance levels. It groups tasks by performance status such as High, Medium, and Low.
Charts Included:
- Pending Task by Performance: Shows pending work based on performance categories.
- Completed Task by Performance: Highlights output quality by performance level.
- Total Task by Performance: Shows total assigned tasks under each performance category.
This page helps you identify strengths and weaknesses within the team.

Monthly Trends Page
Monthly trends are essential for long-term planning. This page highlights how performance, completion, and pending tasks change each month.
Charts Included:
- Pending Task by Month: Shows the number of pending tasks each month.
- Completed Task by Month: Explains how completion rate changes monthly.
- Total Task by Month: Shows total assigned tasks month-by-month.
With this page, you can check progress, forecast workload, and plan upcoming schedules.

Click to Buy Team Performance Dashboard in Google Sheets
Search Feature
The dashboard includes a smart Search section where you can search any task by:
-
Keyword
-
Field Name
This helps you instantly find important tasks, track updates, and filter specific items without scrolling through long lists.

Data Sheet Tab
The Data Sheet is the heart of the dashboard. You enter all raw data in this tab. The dashboard reads from this sheet and updates all visuals automatically.
You maintain:
- Task Name
- Team
- Task Type
- Target Hours
- Actual Hours
- Status
- Assigned Date
- Completion Date
- Performance Level
This structure keeps your dashboard organized, fast, and error-free.

Click to Buy Team Performance Dashboard in Google Sheets
Advantages of Using a Team Performance Dashboard in Google Sheets
Using this dashboard provides many benefits. Let us explore them.
- You Track All Tasks in One Place: You stop using multiple files. Everything stays organized in a single Google Sheet.
- You Monitor Real-Time Performance: Because Google Sheets updates instantly, you always get the latest data.
- You Improve Team Communication: Clear visuals reduce confusion and increase transparency.
- You Save Time on Manual Reporting: Charts update automatically, which eliminates manual calculation or graph creation.
- You Understand Workload Distribution: You see how many tasks teams handle and who needs more support.
- You Improve Productivity: You discover slow areas, performance gaps, and delays. This helps you take corrective actions.
- You Make Better Planning Decisions: Monthly trends and task performance help you plan future projects better.
Opportunities for Improvement
Click to Buy Team Performance Dashboard in Google Sheets
Although this dashboard is powerful, you can add more features to make it stronger:
- Add conditional formatting for performance alerts
- Add automatic email notifications using Google Apps Script
- Add SLA tracking
- Add a workload heatmap
- Add comparison charts for target vs actual hours
- Add team member-wise performance levels
These improvements help you create advanced analytics.
Best Practices for Using the Dashboard
Follow these best practices for smooth usage and accurate results.
Keep your data sheet clean
Avoid blank rows, inconsistent labels, or merged cells.
Update data regularly
Real-time performance depends on fresh data.
Use consistent task naming
This helps maintain clean reports.
Refresh pivot tables if needed
Ensure charts reflect updated information.
Review monthly trends
Monthly insights help you plan long-term strategy.
Share with team members
Allow collaborative updates to reduce workload.
Do not change dashboard formulas
Keep formulas intact for proper functioning.
Conclusion
Click to Buy Team Performance Dashboard in Google Sheets
A Team Performance Dashboard in Google Sheets gives you a complete view of your team’s performance. It simplifies tracking, reduces manual work, and improves decision-making. With KPI cards, task insights, team performance charts, monthly trends, and a search feature, this dashboard works as a powerful productivity tool for every team.
Whether you manage small teams or large projects, this dashboard helps you monitor goals, understand patterns, and build a high-performing workflow.
Frequently Asked Questions (FAQs)
1. What is a Team Performance Dashboard in Google Sheets?
It is a ready-to-use tool that helps you track tasks, hours, performance, and monthly trends in one dashboard.
2. Can beginners use this dashboard?
Yes, the dashboard is extremely simple and user-friendly.
3. Do I need advanced Google Sheets knowledge?
No, you only need basic data entry skills. The dashboard updates automatically.
4. Can I customize the charts?
Yes, you can change colors, chart types, and labels based on your preference.
5. What kind of teams can use this dashboard?
Any team—IT, HR, Marketing, Finance, Operations, or Project Teams—can use it.
6. How often should I update the Data Sheet?
Update it daily or weekly for the best results.
7. Can I use this dashboard for client reporting?
Yes, it is professional, clean, and perfect for presentations.
Visit our YouTube channel to learn step-by-step video tutorials
Youtube.com/@NeotechNavigators
Watch the step-by-step video Demo: