Technical support teams play a critical role in customer satisfaction and business continuity. Every ticket, response, and resolution directly impacts user experience. However, when support data remains scattered across tools or static reports, teams struggle to measure performance and improve service quality.
That is exactly why a Technical Support KPI Dashboard in Google Sheets becomes an essential performance monitoring solution.
This ready-to-use dashboard helps organizations track support efficiency, response quality, and resolution effectiveness using structured KPIs. Moreover, it provides MTD and YTD tracking, target comparisons, and previous year analysis with clear visual indicators.
In this article, you will learn what this dashboard is, how it works, which KPIs it includes, its advantages, improvement opportunities, best practices, and frequently asked questions.
What Is a Technical Support KPI Dashboard in Google Sheets?
A Technical Support KPI Dashboard in Google Sheets is a centralized reporting tool designed to monitor and analyze key performance indicators related to technical support operations.
Instead of manually reviewing ticket logs or monthly reports, this dashboard:
-
Consolidates all support KPIs in one place
-
Tracks Month-to-Date (MTD) and Year-to-Date (YTD) performance
-
Compares Actual vs Target values
-
Compares Current Year vs Previous Year
-
Highlights performance using conditional up/down arrows
Because it runs in Google Sheets, teams can collaborate in real time and update data easily without complex BI tools.
Why Do Technical Support Teams Need KPI Dashboards?
Click to Buy Technical Support KPI Dashboard in Google Sheets
Support teams handle high ticket volumes, strict SLAs, and constant customer expectations. Therefore, KPI tracking helps organizations:
- Improve response and resolution times
- Reduce backlog and escalations
- Increase first-contact resolution
- Optimize team workload
- Improve customer satisfaction
As a result, support operations become more efficient and predictable.
Key Features of the Technical Support KPI Dashboard
This dashboard follows a structured and scalable design suitable for IT, SaaS, and enterprise support teams.
Key Highlights
- Month selector for dynamic analysis
- MTD and YTD KPI tracking
- Target vs Actual comparison
- Previous Year comparison
- Conditional formatting with arrows
- Dedicated KPI trend analysis
- Separate data entry and KPI definition sheets
Dashboard Sheet Tab – Main KPI Overview
Click to Buy Technical Support KPI Dashboard in Google Sheets
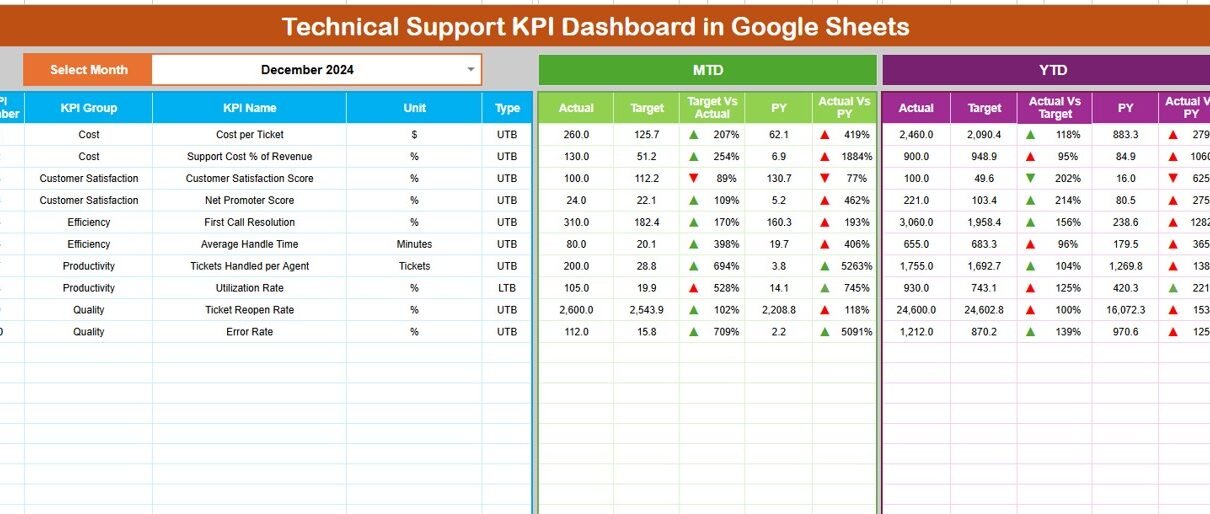
The Dashboard Sheet provides a high-level summary of technical support performance.
Month Selection
-
Select the month from Cell D3
-
All KPIs update automatically based on selection
MTD KPIs Displayed
For each KPI, the dashboard shows:
-
MTD Actual
-
MTD Target
-
MTD Previous Year
-
Target vs Actual (%)
-
PY vs Actual (%)
Visual arrows clearly indicate improvement or decline.
YTD KPIs Displayed
The dashboard also displays:
-
YTD Actual
-
YTD Target
-
YTD Previous Year
-
Target vs Actual (%)
-
PY vs Actual (%)
This view supports long-term support performance evaluation.

Click to Buy Technical Support KPI Dashboard in Google Sheets
KPI Trend Sheet Tab – KPI Deep Dive
The KPI Trend Sheet explains each KPI in detail.
How It Works
-
Select a KPI from the dropdown in Cell C3
-
The sheet automatically displays KPI details
Displayed Information
-
KPI Group
-
KPI Unit
-
KPI Type (Lower the Better / Upper the Better)
-
KPI Formula
-
KPI Definition
This ensures clarity and consistent understanding across teams.

Actual Number Sheet Tab
This sheet captures real performance data.
Usage Instructions
-
Enter the first month of the year in Cell E1
-
Input MTD Actual and YTD Actual values
-
Dashboard updates automatically

Click to Buy Technical Support KPI Dashboard in Google Sheets
Target Sheet Tab
The Target Sheet defines expected performance benchmarks.
Data Entry
-
Enter MTD Target values
-
Enter YTD Target values
Targets help teams measure success objectively.

Previous Year Number Sheet Tab
Historical performance enables meaningful comparison.
Purpose
- Enter previous year MTD and YTD values
- Identify recurring support issues
- Measure improvement trends

Click to Buy Technical Support KPI Dashboard in Google Sheets
KPI Definition Sheet Tab – KPI Master
This sheet stores the complete KPI library.
Fields Included
- KPI Name
- KPI Group
- Unit
- Formula
- KPI Definition
- KPI Type

Click to Buy Technical Support KPI Dashboard in Google Sheets
Advantages of Technical Support KPI Dashboard in Google Sheets
-
Centralized support performance tracking
-
Faster issue identification
-
Improved SLA compliance
-
Better agent workload management
-
Enhanced customer satisfaction
-
Easy collaboration and sharing
-
No expensive BI tools required
Opportunities for Improvement
Organizations can enhance this dashboard by:
-
Adding channel-wise support KPIs
-
Tracking agent-level performance
-
Integrating customer feedback comments
-
Automating ticket data imports
-
Adding predictive backlog analysis
Best Practices for Using the Technical Support KPI Dashboard
Click to Buy Technical Support KPI Dashboard in Google Sheets
-
Update ticket data regularly
-
Review KPIs weekly and monthly
-
Compare Actual vs Target consistently
-
Focus on root causes, not just numbers
-
Share insights with support leadership
-
Use trends to improve support processes
Conclusion
A Technical Support KPI Dashboard in Google Sheets transforms raw ticket data into actionable insights. It helps teams improve response speed, resolution quality, and customer satisfaction while maintaining operational efficiency.
Because the dashboard is flexible, collaborative, and scalable, it becomes a long-term solution for modern technical support teams.
Frequently Asked Questions (FAQs)
Click to Buy Technical Support KPI Dashboard in Google Sheets
1. Who should use this dashboard?
IT support teams, service desks, SaaS support teams, and operations managers.
2. Can KPIs be customized?
Yes, all KPIs, formulas, and targets are fully customizable.
3. Does the dashboard support MTD and YTD tracking?
Yes, it supports both with historical comparisons.
4. Is Google Sheets secure for support data?
Yes, with proper access permissions and sharing controls.
5. Can this dashboard scale for large support teams?
Yes, it works for small teams and enterprise-level support operations.
Watch the step-by-step video tutorial:
Visit our YouTube channel to learn step-by-step video tutorials
Youtube.com/@NeotechNavigators
Click to Buy Technical Support KPI Dashboard in Google Sheets