Effective management and analysis of customer service tickets are essential in the telecommunications industry. The Telecommunications Dashboard in Google Sheets is a ready-to-use tool designed to track and manage customer service tickets, providing valuable insights into response times, resolution times, customer ratings, and much more. This dashboard makes it easy to monitor key metrics, track ticket statuses, and identify areas for improvement, helping telecommunications companies deliver exceptional customer service.
In this article, we will explain the key features of the Telecommunications Dashboard in Google Sheets and how it can help your organization manage customer service tickets efficiently.
What is the Telecommunications Dashboard in Google Sheets?
The Telecommunications Dashboard in Google Sheets is a comprehensive tool designed to track and analyze customer service tickets in the telecommunications sector. The dashboard provides visual charts and detailed data for key metrics such as response time, resolution time, and customer ratings. It helps customer service teams monitor their performance, identify trends, and make data-driven decisions to improve service quality.
The dashboard consists of the following sheet tabs:
Key Features of the Telecommunications Dashboard
1) Dashboard Sheet Tab: Centralized Overview of Key Metrics
Click to buy Telecommunications Dashboard in Google Sheets
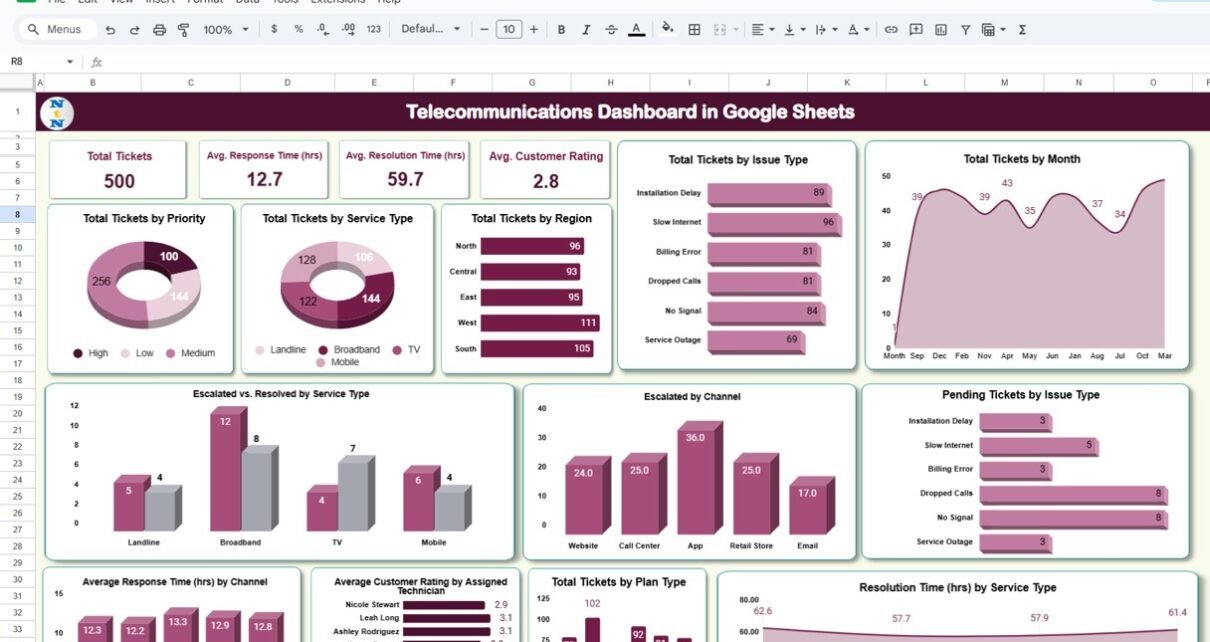
The Dashboard Sheet Tab is the heart of the tool, where you can view an overview of important key performance indicators (KPIs) related to customer service tickets. This sheet includes various charts and cards that display key metrics:
Cards:
- Total Tickets: Displays the total number of customer service tickets.
- Avg. Response Time (hrs): Shows the average response time for customer tickets in hours.
- Avg. Resolution Time (hrs): Indicates the average time taken to resolve customer tickets.
- Avg. Customer Rating: Displays the average rating given by customers (on a scale of 1-5).
Charts:
- Total Tickets by Issue Type: Breaks down the total number of tickets by the type of issue reported (e.g., no signal, slow speeds, etc.).
- Total Tickets by Month: Displays the number of tickets created each month, helping you monitor trends over time.
- Total Tickets by Priority: Shows the number of tickets categorized by priority (e.g., high, medium, low).
- Total Tickets by Service Type: Tracks tickets for different service types (e.g., broadband, mobile, TV).
- Total Tickets by Region: Displays tickets by geographic region, helping identify areas with higher ticket volumes.
- Escalated vs. Resolved by Service Type: Compares the number of escalated tickets versus resolved tickets for each service type.
- Escalated by Channel: Tracks the number of escalated tickets based on the communication channel (e.g., email, app, call center).
- Pending Tickets by Issue Type: Shows the number of tickets that are still pending, categorized by issue type.
- Average Response Time (hrs) by Channel: Breaks down the average response time for tickets based on the communication channel.
- Average Customer Rating by Assigned Technician: Shows the average customer rating for each technician assigned to the tickets.
- Total Tickets by Plan Type: Tracks tickets by plan type (e.g., prepaid, postpaid).
- Resolution Time (hrs) by Service Type: Displays the average resolution time for tickets based on service type.
These cards and charts offer an at-a-glance overview of key service metrics, helping you identify issues and take appropriate actions quickly.

Click to buy Telecommunications Dashboard in Google Sheets
2) Search Sheet Tab: Quick Data Retrieval
The Search Sheet Tab allows you to search and filter customer service tickets based on specific criteria. Features include:
-
Search by Search Keyword and Field Name: You can search by any field, such as Issue Type, Priority, or Service Type. For example, if you want to find tickets related to “no signal,” you can filter the data by this keyword.
-
Total Records and Filtered Data: The search function will display the total number of records matching your search criteria, providing insights into the volume of specific issues.
This tab makes it easy to quickly locate and analyze tickets based on specific keywords or fields, improving efficiency in ticket management.

Click to buy Telecommunications Dashboard in Google Sheets
3) Data Sheet Tab: Detailed Ticket Information
The Data Sheet Tab is where you input and manage detailed information about each customer service ticket. The key columns in this sheet include:

Benefits of Using the Telecommunications Dashboard
The Telecommunications Dashboard in Google Sheets offers several advantages for customer service teams and managers:
-
Centralized Ticket Management: All ticket-related information is stored in one place, making it easier to track, manage, and analyze customer issues.
-
Real-Time Insights: The charts and data visualization features provide real-time insights into key metrics, helping you monitor ticket performance and take corrective actions.
-
Improved Customer Service: By tracking ticket resolution times, response times, and customer ratings, you can identify areas for improvement and enhance customer service.
-
Data-Driven Decision Making: The dashboard helps you make informed decisions based on ticket trends, allowing you to allocate resources more effectively.
-
Customizable: The template is fully customizable to meet the unique needs of your organization, whether you’re managing a small team or a large-scale telecommunications service.
Best Practices for Using the Telecommunications Dashboard
Click to buy Telecommunications Dashboard in Google Sheets
To get the most out of the Telecommunications Dashboard, follow these best practices:
-
Update Regularly: Ensure the data is updated regularly to reflect the latest ticket statuses, resolution times, and customer feedback.
-
Monitor Key Metrics: Use the dashboard to monitor key performance indicators, such as response time and customer rating, and take action to improve areas that need attention.
-
Track Ticket Status: Regularly check the Escalated vs. Resolved charts to ensure that tickets are being handled promptly and escalated when necessary.
-
Analyze Customer Feedback: Pay attention to Customer Rating and Resolution Time data to assess technician performance and identify training opportunities.
-
Share with Your Team: Share the dashboard with team members for collaborative monitoring and improvement of customer service processes.
Conclusion
The Telecommunications Dashboard in Google Sheets is an essential tool for managing customer service tickets in the telecommunications industry. By providing real-time data visualization, tracking key metrics, and centralizing ticket information, this dashboard helps businesses improve service efficiency, reduce response times, and enhance customer satisfaction. With its customizable features and user-friendly interface, this tool is a must-have for managing and optimizing customer service operations.
Frequently Asked Questions (FAQs)
Click to buy Telecommunications Dashboard in Google Sheets
1. How do I update the Telecommunications Dashboard?
You can update the dashboard by adding new ticket data to the Data Sheet Tab. The charts and cards will automatically update based on the new data.
2. Can I filter tickets by issue type or region?
Yes, the Search Sheet Tab allows you to filter tickets by specific criteria, such as issue type, region, or priority.
3. How do I track technician performance?
You can monitor technician performance through the Avg. Customer Rating by Assigned Technician chart and analyze the average response and resolution times.
4. Can I share the dashboard with my team?
Yes, since the dashboard is built in Google Sheets, you can easily share it with your team for real-time collaboration and updates.
5. Is the dashboard customizable for my organization’s needs?
Yes, the dashboard is fully customizable. You can modify the fields, charts, and categories to fit your organization’s specific requirements.
Visit our YouTube channel to learn step-by-step video tutorials
Youtube.com/@NeotechNavigators