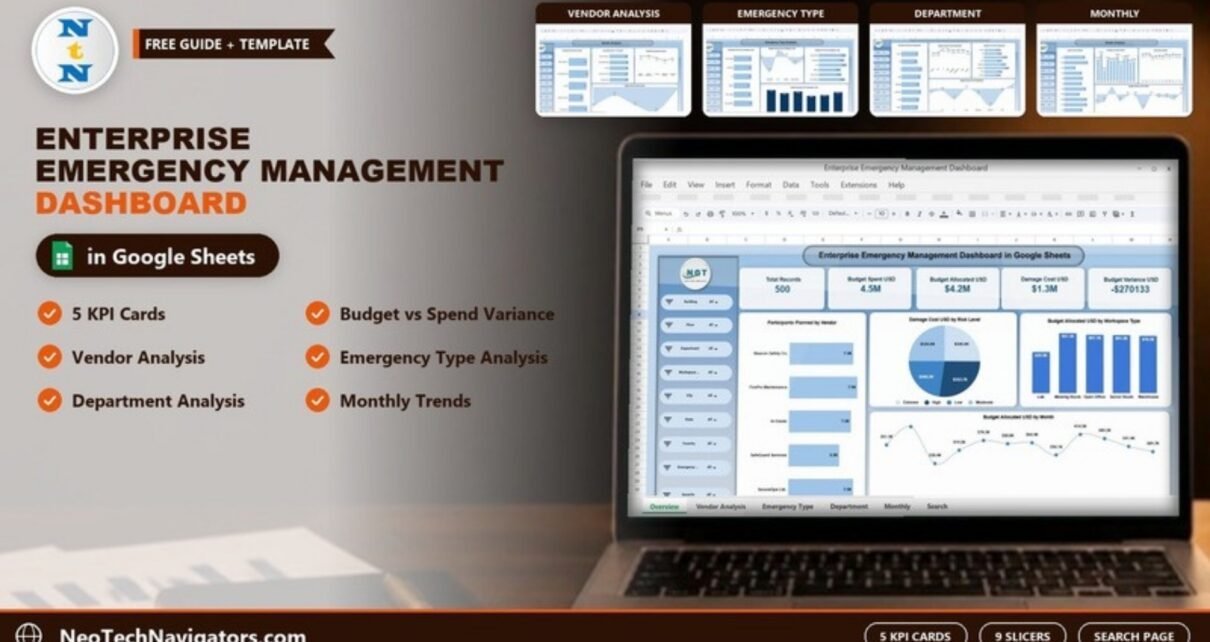
The Enterprise Emergency Management Dashboard in Google Sheets turns a log of drills, incidents, inspections and training sessions into an interactive report across buildings, departments, vendors and emergency types. Five KPI cards show total records, budget spent, budget allocated, damage cost and budget variance, and four analysis pages break the numbers down by vendor, emergency type, department and month.
It is built for emergency management teams, safety and compliance officers, facility managers and finance leads in organisations with several buildings or sites. This guide covers every page and chart using the sample data, the KPIs and how they relate, the search sheet, setup steps, use cases, best practices and the dashboard’s limits.
Get the Enterprise Emergency Management Dashboard
What Problem Does This Dashboard Solve?
Large organisations run fire drills, evacuation exercises, tabletop sessions and safety inspections across many buildings, and they also record real incidents such as fires, medical events, power outages, cyber incidents and severe weather. That data is usually split between safety, facilities and finance. Leadership then struggles to answer basic questions:
- How much have we spent on emergency preparedness against what we budgeted?
- Which emergency types cause the most damage cost?
- Which departments and vendors are over budget?
- Are training vendors getting people to attend, and how well do they score?
- Are injuries and damage higher in certain months?
This dashboard brings all of it into one Google Sheets file with slicers, so you can filter by building, floor, department, workspace type, city, state, country, emergency type and severity, and every chart updates together.
Pages Inside the Enterprise Emergency Management Dashboard
| Page | What it shows |
|---|---|
| Overview | Five KPI cards, participants planned by vendor, damage cost by risk level, budget allocated by workspace type and by month |
| Vendor Analysis | Participants planned and attended by vendor, average training score % by vendor, budget variance by vendor |
| Emergency Type Analysis | Participants planned, budget variance, damage cost and budget allocated by emergency type |
| Department Analysis | Participants planned, budget allocated, damage cost and budget variance by department |
| Monthly Analysis | Injuries count, damage cost, average impact and budget variance by month |
| Search and Data | Keyword search on any column with a Total Record count |
Every analysis page has the same slicer panel on the left: Building, Floor, Department, Workspace Type, City, State, Country, Emergency Type and Severity.
KPI Cards on the Overview Page
The sample file contains 500 records. These are the five headline KPIs and how to read them.
| KPI card | What it measures | Sample value | Better when |
|---|---|---|---|
| Total Records | Number of drills, incidents, inspections and training records in the current filter | 500 | Context only |
| Budget Spent USD | Total actual spend across the filtered records | 4.5M | At or below allocation |
| Budget Allocated USD | Total budget assigned to the filtered records | $4.2M | Context for spend |
| Damage Cost USD | Total cost of damage recorded | $1.3M | Lower |
| Budget Variance USD | Gap between allocated and spent budget | -$270,133 | Zero or positive |
In the sample, the variance is negative because spend ($4.5M) runs above allocation ($4.2M), in other words the activities overspent their budget overall. The card values are consistent with this calculation:
Budget Variance = Budget Allocated − Budget Spent
                ≈ $4.2M − $4.5M  →  about −$0.27M overspend
Overview Page
Below the KPI cards, the Overview page shows four charts:
- Participants Planned by Vendor: Beacon Safety Co. 7.4K, FirePro Maintenance 7.9K, In-house 7.2K, SafeGuard Services 5.9K and SecureOps Ltd. 7.5K.
- Damage Cost USD by Risk Level: a pie split across Extreme, High, Low and Moderate, each between roughly $296K and $353K in the sample.
- Budget Allocated USD by Workspace Type: Lab 629.9K, Meeting Room 921.1K, Open Office 897.7K, Server Room 891.2K and Warehouse 878.2K.
- Budget Allocated USD by Month: a line from about 238K to 415K per month.

Vendor Analysis
This page compares the training and response vendors you work with:
- Participants Planned by Vendor and Participants Attended by Vendor (Beacon Safety Co. 6.8K, FirePro Maintenance 7.1K, In-house 6.1K, SafeGuard Services 5.3K, SecureOps Ltd. 6.0K attended).
- Avg. Training Score % by Vendor: between 82% and 84%, with FirePro Maintenance highest at 84%.
- Budget Variance USD by Vendor.
Worked example: comparing the two participant charts gives you an attendance rate. Beacon Safety Co. planned 7.4K participants and 6.8K attended, about 92%. SecureOps Ltd. planned 7.5K and 6.0K attended, about 80%. That gap is worth raising with the vendor even though both training scores are similar.
Attendance rate = Participants Attended / Participants Planned
Beacon Safety Co. = 6.8K / 7.4K ≈ 92%
SecureOps Ltd.    = 6.0K / 7.5K ≈ 80%
Emergency Type Analysis
The sample covers six emergency types: Cyber Incident, Earthquake, Fire, Medical, Power Outage and Severe Weather. The page shows:
- Participants Planned by Emergency Type: from 5.5K (Medical) to 6.2K (Severe Weather).
- Budget Variance USD by Emergency Type: Earthquake shows the largest overspend in the sample at about −200,709.
- Damage Cost USD by Emergency Type: Cyber Incident $232.5K, Earthquake $220.1K, Fire $239.5K, Medical $187.2K, Power Outage $194.7K and Severe Weather $224.9K.
- Budget Allocated USD by Emergency Type: from about 609.5K to 797.9K per type.

Department Analysis
This page covers eight departments: Finance, HR, IT, Legal, Marketing, Operations, Sales and Security.
- Participants Planned by Department: IT leads with 5.1K; HR is lowest at 4.0K.
- Budget Allocated USD by Department: from about 459.5K to 598.3K.
- Damage Cost USD by Department: Operations is highest at $205.8K, followed by IT at $192.7K and Marketing at $181.1K.
- Budget Variance USD by Department: Operations shows the largest overspend at about −125,939, while Legal is slightly positive at 1.7K.

Monthly Analysis
The monthly page helps you spot seasonal patterns. (In the sample file this page’s banner still reads “Vendor Analysis”, so rename it to “Monthly Analysis” in your copy if you like.)
- Injuries Count by Month: August (52), May (50) and November (50) are the highest of the months visible in the screenshot, while December is lowest at 25.
- Damage Cost USD by Month: August again peaks at $142.2K; December is lowest at $56.0K.
- Avg. Impact by Month: a steady line between 0.51 and 0.58.
- Budget Variance USD by Month: mostly negative, with the deepest overspend around −101,793.

Search and Data Page
Pick a column in Select Column, type a value in Search Keyword, and the sheet lists every matching record with a Total Record count. Searching the Department column for “HR” returns 57 of the 500 records.
The data behind the dashboard includes Record ID, Record Type (Drill, Incident, Inspection, Training), Event Date, Building, Floor, Department, Workspace Type, City, State, Country, Emergency Type, Severity (Low, Medium, High, Critical), Drill Type (such as Tabletop, Evacuation, Fire Warden, Lockdown), Drill Outcome (Pass, Fail, N/A), Evacuation Time (min), Participants Planned and further participant and cost fields.

How to Use It With Your Own Data
- Make your own copy with File > Make a copy.
- Study the data columns and map your own drill, incident, inspection and training records to them.
- Standardise your lists for buildings, departments, vendors, emergency types, severity and risk levels before you paste data.
- Replace the sample rows with your records, keeping the column order and headers unchanged.
- Enter budget allocated and budget spent for each record so the variance charts work.
- Check the Overview to confirm totals look right, then use the slicers to filter by site, department or emergency type.
- Review monthly: start with the KPI cards, then the department and vendor pages for overspend, then the monthly page for trends.
Real-World Use Cases
Quarterly preparedness review for leadership
The safety head filters to the last quarter and presents the KPI cards, damage cost by emergency type and the departments with the biggest overspend.
Vendor contract renewal
Before renewing training contracts, procurement compares vendors on attendance, average training score and budget variance using the Vendor Analysis page.
Site-level risk planning
A facilities manager filters by building and severity to see which sites record the most critical incidents and where drills fail most often.
Best Practices
- Record drills, inspections and training as well as real incidents, so preparedness and impact can be compared.
- Use one list of emergency types and severity levels across all sites.
- Enter budget allocated before an activity and budget spent after it, every time.
- Review the monthly page before peak-risk seasons for your region.
- Read vendor attendance and training score together, not in isolation.
- Restrict edit access to the data sheet and share the dashboard view with managers.
Who Should Not Use This Dashboard (Limitations)
- Not a live incident system. It reports on recorded data; it does not alert staff or coordinate a live emergency.
- Manual data entry. Records must be typed or pasted in; there is no connection to access control, fire panels or ticketing tools.
- Single-file scale. Google Sheets works well for hundreds or a few thousand records; very large global datasets may be slow.
- Small offices with one site and few drills may find a simpler checklist or tracker easier to maintain.
Related Templates and Guides
For a lighter version, see the emergency management dashboard in Google Sheets or the office emergency preparedness dashboard. To collect and approve plans from each site, use the office emergency response plan submission tracker. For KPI-style reporting, compare it with the crisis management KPI dashboard and the workplace safety and incident management dashboard.
Related templates: the Emergency Management Dashboard in Excel and the Emergency Management Dashboard in Power BI on NextGenTemplates.
If you want to build dashboards like this yourself, the Excel Pivot Tables and Dashboards course on NextGenTemplates Academy teaches you how to summarise data, add slicers and design report pages step by step.
Frequently Asked Questions
What is an enterprise emergency management dashboard?
It is a report that summarises emergency drills, incidents, inspections and training across sites, showing budget, damage cost, participation and trends so leaders can plan preparedness and control spend.
Which emergency types are included?
The sample covers Cyber Incident, Earthquake, Fire, Medical, Power Outage and Severe Weather. You can use your own types as long as you keep them consistent in the data.
How is Budget Variance calculated?
It shows the gap between budget allocated and budget spent. In the sample, spend of $4.5M against $4.2M allocated gives a negative variance of about −$270K, meaning an overspend.
Can I filter by building or city?
Yes. Every dashboard page has slicers for Building, Floor, Department, Workspace Type, City, State, Country, Emergency Type and Severity.
Can several people work in it at once?
Yes. It is a Google Sheets file, so team members can view and edit it together with normal sharing permissions.
Does it track individual drill results?
Yes, at record level. Each row can hold the drill type, drill outcome (Pass, Fail or N/A) and evacuation time, which you can find through the search page.
Wrapping Up
Emergency preparedness is easier to manage when spend, damage, participation and trends sit in one place. The Enterprise Emergency Management Dashboard in Google Sheets gives you five KPI cards, four analysis pages with consistent slicers and a search page for detail. Load your drill, incident and training records, check the Overview totals, and use the department, vendor and monthly views to decide where to act next.
Get the Enterprise Emergency Management Dashboard
📅 Last updated: October 2026