Running a theme park is no small task. From managing visitor numbers and ticket sales to ensuring rides run smoothly and staff deliver excellent service, every aspect requires close monitoring. To keep everything on track, you need data-driven insights. That’s where a Theme Park KPI Dashboard in Google Sheets comes into play.
This powerful yet simple tool helps theme park managers measure key performance indicators (KPIs) in real time. It transforms raw data into meaningful visuals, enabling managers to make informed decisions quickly. Whether you’re tracking daily attendance, ride utilization, revenue, or guest satisfaction, this dashboard centralizes all important metrics in one place.
Click to buy Theme Park KPI Dashboard in Google Sheets
In this article, we will cover:
- What a Theme Park KPI Dashboard in Google Sheets is.
- The structure of the dashboard with its six worksheet tabs.
- Advantages of using it for theme park management.
- Best practices to set it up and maintain accuracy.
- Use cases that prove its real-world benefits.
- Frequently asked questions to guide new users.
What Is a Theme Park KPI Dashboard in Google Sheets?
A Theme Park KPI Dashboard in Google Sheets is a ready-to-use template designed to help amusement and entertainment parks monitor their operations. Instead of relying on scattered reports or outdated paper logs, managers can view all essential KPIs in one interactive dashboard.
Because it’s built in Google Sheets, it’s:
- Cloud-based – accessible from anywhere, anytime.
- Collaborative – multiple team members can update and view it in real time.
- Cost-effective – no need for expensive BI tools.
- Customizable – you can tailor the KPIs and visuals to suit your park’s needs.
Structure of the Theme Park KPI Dashboard
This dashboard template comes with six dedicated worksheet tabs, each serving a specific purpose. Let’s explore them one by one.
Dashboard Sheet Tab
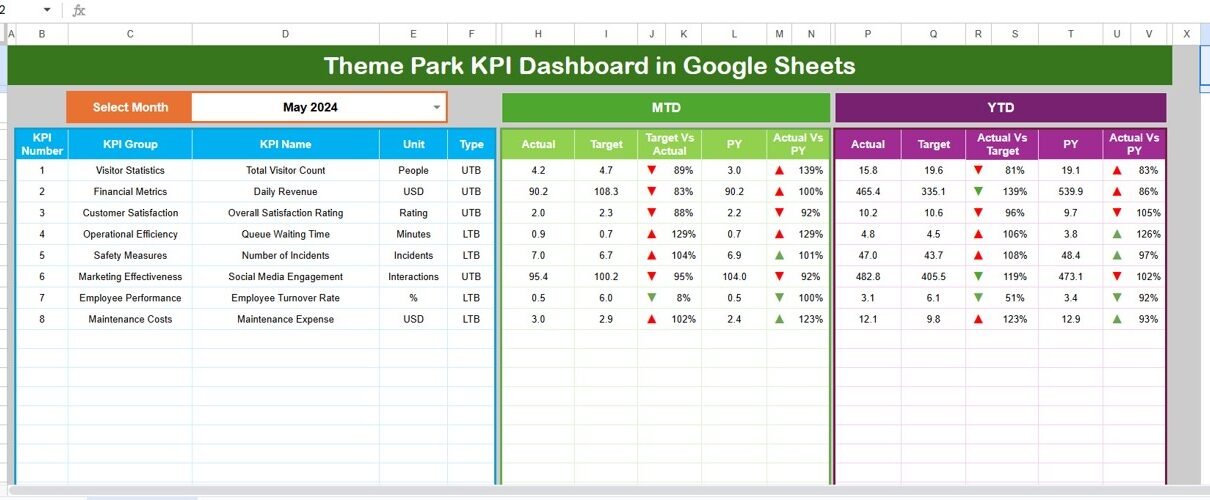
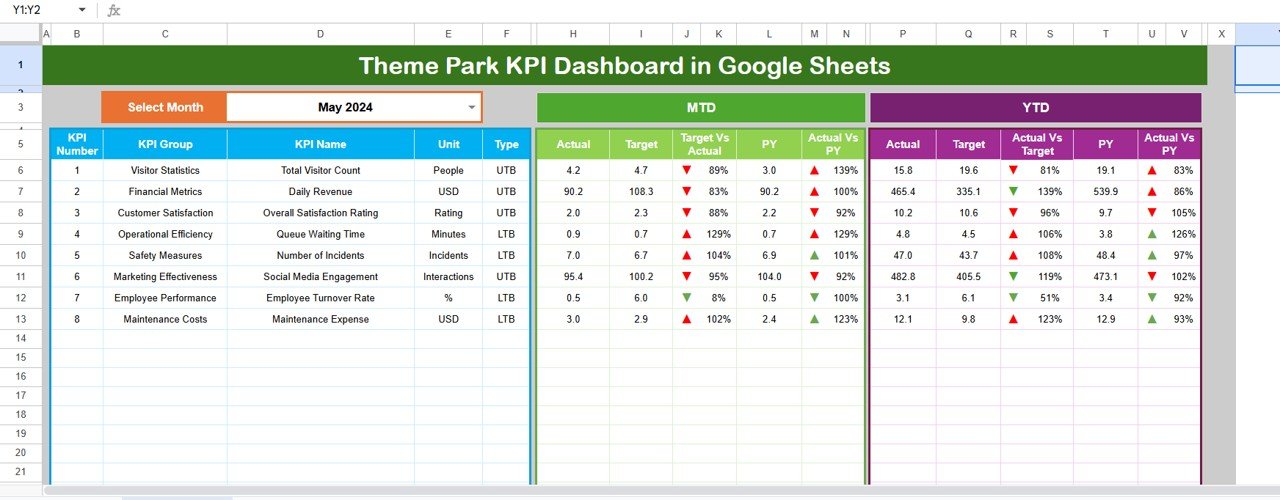
The Dashboard sheet tab is the main interface. Here, you can see all KPIs summarized in one view.
- A dropdown menu in cell D3 allows you to select a month. The entire dashboard updates automatically to display data for that period.
- You can view Month-to-Date (MTD) Actual, Target, and Previous Year values.
- The dashboard compares these values with conditional formatting arrows showing whether performance is above or below expectations.
- It also shows Year-to-Date (YTD) Actual vs Target vs Previous Year.
This sheet provides an instant snapshot of your park’s performance.
Click to buy Theme Park KPI Dashboard in Google Sheets
Trend Sheet Tab
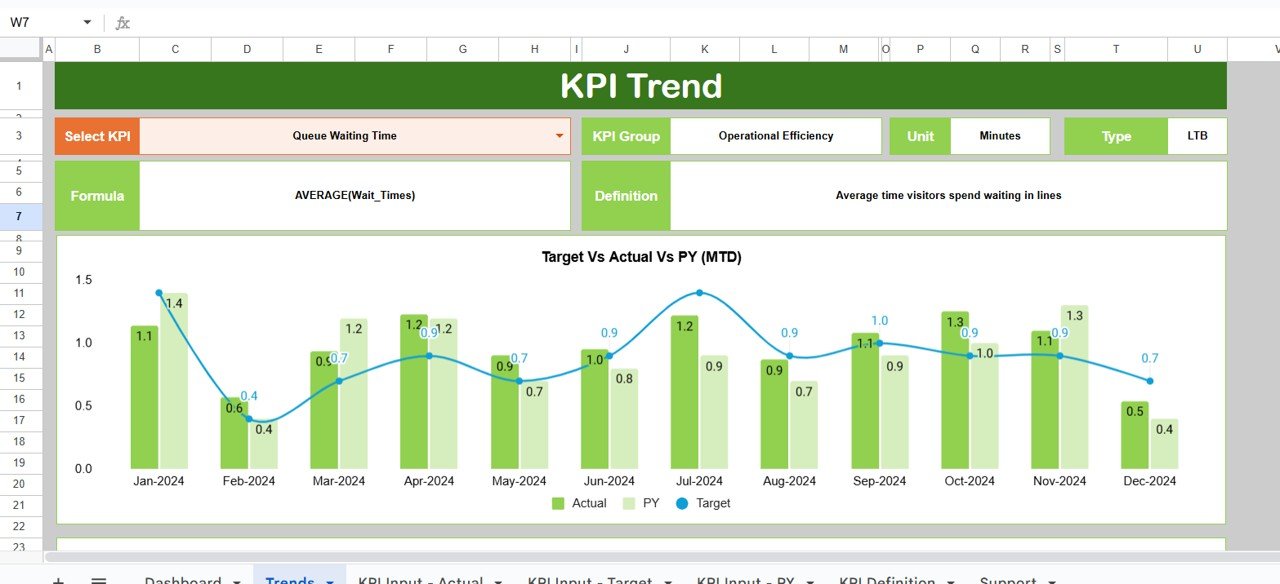
The Trend sheet tab focuses on KPI trends over time.
- A dropdown menu in cell C3 allows you to select any KPI.
- You can view supporting details like KPI Group, Unit of Measure, KPI Type (Lower the Better or Upper the Better), Formula, and Definition.
- Trend charts display MTD and YTD data for Actual, Target, and Previous Year values.
This sheet helps managers identify growth patterns, seasonal shifts, and areas needing improvement.
Actual Numbers Input Sheet
Data accuracy begins here. The Actual Numbers Input sheet is where you enter real data.
- Input MTD and YTD values for each KPI.
- Use cell E1 to define the first month of the year, ensuring the entire dashboard aligns with your park’s fiscal calendar.
-
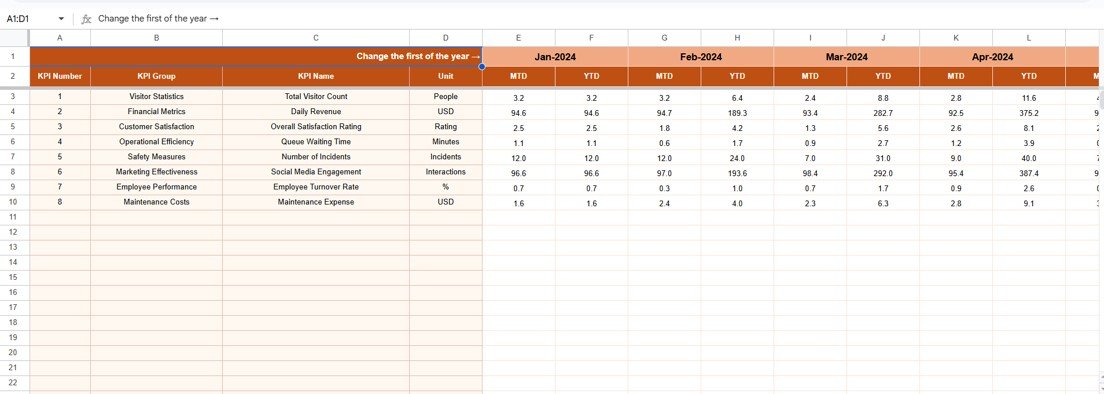
Actual Numbers Input Sheet
This sheet is essential for maintaining up-to-date and reliable results.
Target Sheet Tab
The Target sheet tab stores benchmark values.
- Enter monthly targets for both MTD and YTD for each KPI.
- Targets act as performance goals that managers compare against actual results.
By having clearly defined targets, the dashboard immediately shows whether operations are on track.
Previous Year Numbers Sheet
This sheet records previous year’s values.
- Input MTD and YTD results from last year.
- Comparing current performance with historical numbers highlights growth and operational trends.
This backward comparison is crucial for understanding whether the park is improving year after year.
KPI Definition Sheet
The KPI Definition sheet serves as the reference library.
- It lists all KPIs with details such as KPI Group, Unit, Formula, and a simple Definition.
- Having this sheet ensures everyone understands what each KPI means, preventing misinterpretation.
This reference section makes the dashboard not just a tool but also a training resource for staff.
Why Do Theme Parks Need KPI Dashboards?
Theme parks have countless moving parts: rides, staff, shops, ticketing systems, and guest services. Without data visibility, inefficiencies creep in. A KPI Dashboard in Google Sheets solves this by:
- Centralizing data in one platform.
- Tracking financial health by monitoring revenue, costs, and profits.
- Improving guest experience by analyzing wait times, ride availability, and satisfaction scores.
- Enhancing safety compliance by ensuring operational standards are met.
- Boosting staff productivity by comparing performance with set targets.
Advantages of Theme Park KPI Dashboard in Google Sheets
Using this dashboard has numerous benefits for theme park managers.
🎯 Centralized Information
All KPIs are stored in one interactive sheet, reducing dependency on multiple reports.
📊 Real-Time Insights
Since it is cloud-based, managers always access the latest numbers without delays.
💰 Cost-Effective
Google Sheets is free, which makes this dashboard affordable compared to expensive BI software.
🔧 Customizable and Scalable
You can add, remove, or adjust KPIs as your park grows or strategies change.
🤝 Easy Collaboration
Multiple departments—finance, operations, and guest services—can work together seamlessly.
📈 Performance Tracking
With actual vs target comparisons, you always know whether you’re ahead or behind goals.
Key KPIs to Track in a Theme Park
When setting up this dashboard, consider including the following KPIs:
- Daily Attendance – number of visitors per day.
- Ticket Revenue – total income from ticket sales.
- Per Capita Spending – average guest spending on food, merchandise, etc.
- Ride Utilization Rate – percentage of rides operating vs total rides.
- Guest Satisfaction Score – feedback collected via surveys.
- Safety Incidents – number of accidents or breakdowns.
- Staff Efficiency – productivity compared to set targets.
- Seasonal Trends – month-wise fluctuations in visitors and revenue.
Best Practices for Using a Theme Park KPI Dashboard in Google Sheets
To maximize the benefits, follow these best practices:
- Define Clear KPIs – ensure each KPI is measurable, relevant, and aligned with business goals.
- Update Data Regularly – keep actuals and targets up to date for accurate results.
- Train Your Team – make sure staff understand how to read and update the dashboard.
- Use Visual Cues – apply conditional formatting, arrows, and charts for easy interpretation.
- Benchmark Against History – compare with previous year numbers to evaluate growth.
- Review Monthly – schedule regular reviews to track trends and address issues early.
- Keep It Simple – avoid clutter by focusing only on meaningful KPIs.
Who Can Benefit From This Dashboard?
- Theme Park Owners – to oversee business performance.
- Operations Managers – to track ride utilization and staff efficiency.
- Finance Teams – to analyze revenue vs costs.
- Marketing Teams – to identify trends and plan promotions.
- Guest Services – to monitor satisfaction scores and reduce complaints.
Conclusion
A Theme Park KPI Dashboard in Google Sheets is more than just a reporting tool—it’s a decision-making companion. By centralizing KPIs, enabling real-time analysis, and simplifying collaboration, it helps theme parks operate smoothly while delighting visitors.
With the right setup and consistent updates, you can transform data into actionable insights that drive growth, efficiency, and guest satisfaction.
👉 Start using a Theme Park KPI Dashboard in Google Sheets today and bring data-driven clarity to your amusement park management.
Frequently Asked Questions (FAQs)
- What is a Theme Park KPI Dashboard in Google Sheets?
It is a cloud-based tool that tracks essential KPIs such as attendance, revenue, and ride utilization in one interactive dashboard.
- Can I customize the dashboard to fit my park’s needs?
Yes. You can add or remove KPIs, adjust formulas, and change visualizations to match your park’s unique goals.
- Do I need advanced technical skills to use it?
No. The template is user-friendly and requires only basic Google Sheets knowledge.
- How often should I update the data?
You should update data at least monthly, but for accurate insights, weekly or daily updates are recommended.
- What makes Google Sheets better than other BI tools?
Google Sheets is free, collaborative, and flexible, making it perfect for small and medium-sized parks that want a cost-effective solution.
- Can multiple people work on the dashboard at the same time?
Yes. Google Sheets allows real-time collaboration, so different departments can update and review the dashboard simultaneously.
- Does the dashboard help with safety monitoring?
Yes. By tracking safety incidents and compliance KPIs, it ensures smooth and safe park operations.
Visit our YouTube channel to learn step-by-step video tutorials
Youtube.com/@NeotechNavigators